Stocks Post Third Straight Week of Losses

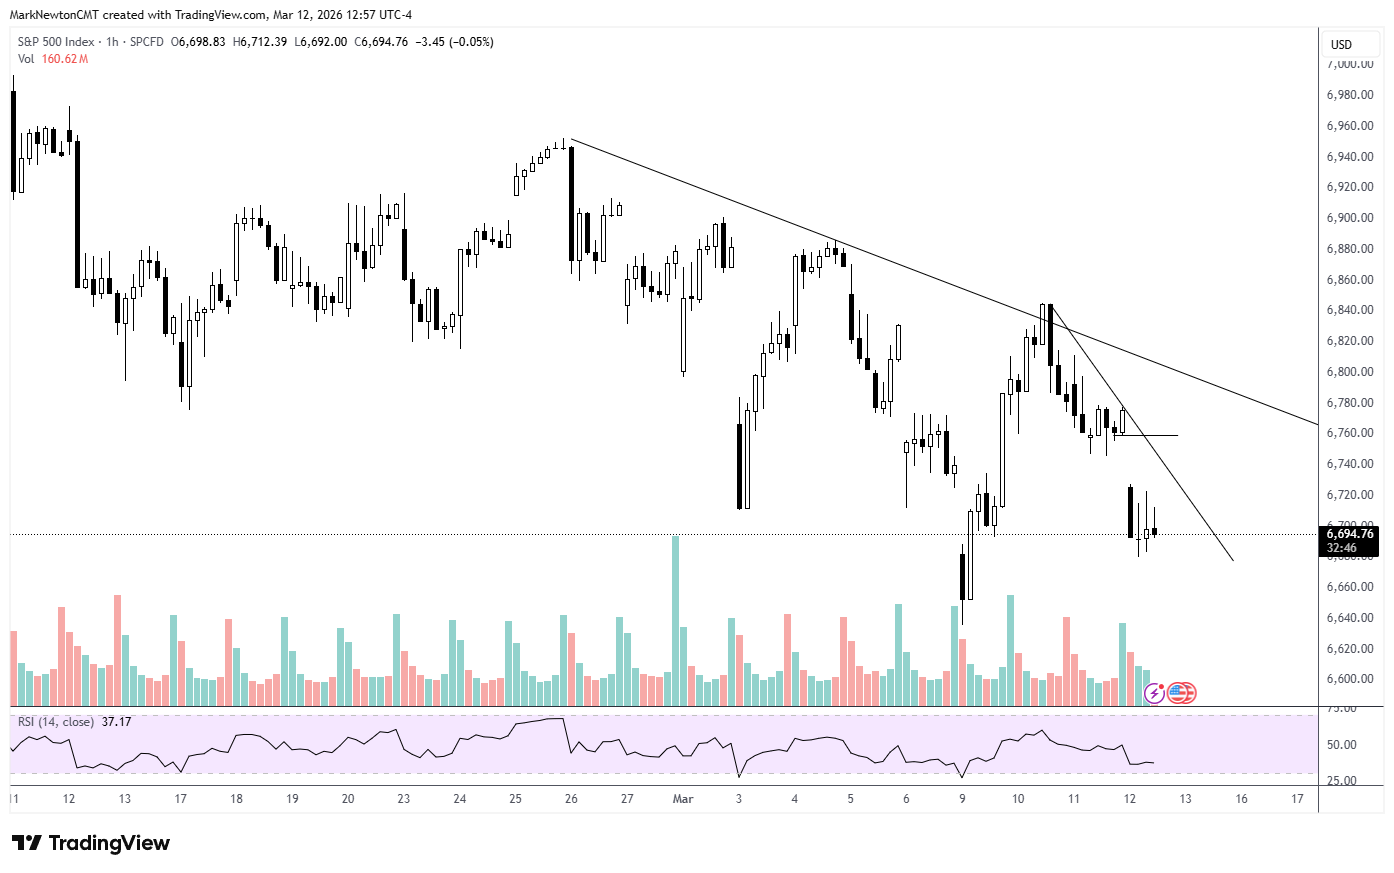
The S&P 500 lost 1.6% this week, down for the third week in a row and marking its longest losing streak since the four-week long stretch ending on March 14, 2025. Nine out of 11 sectors fell, with only energy and utilities segments in the green. 

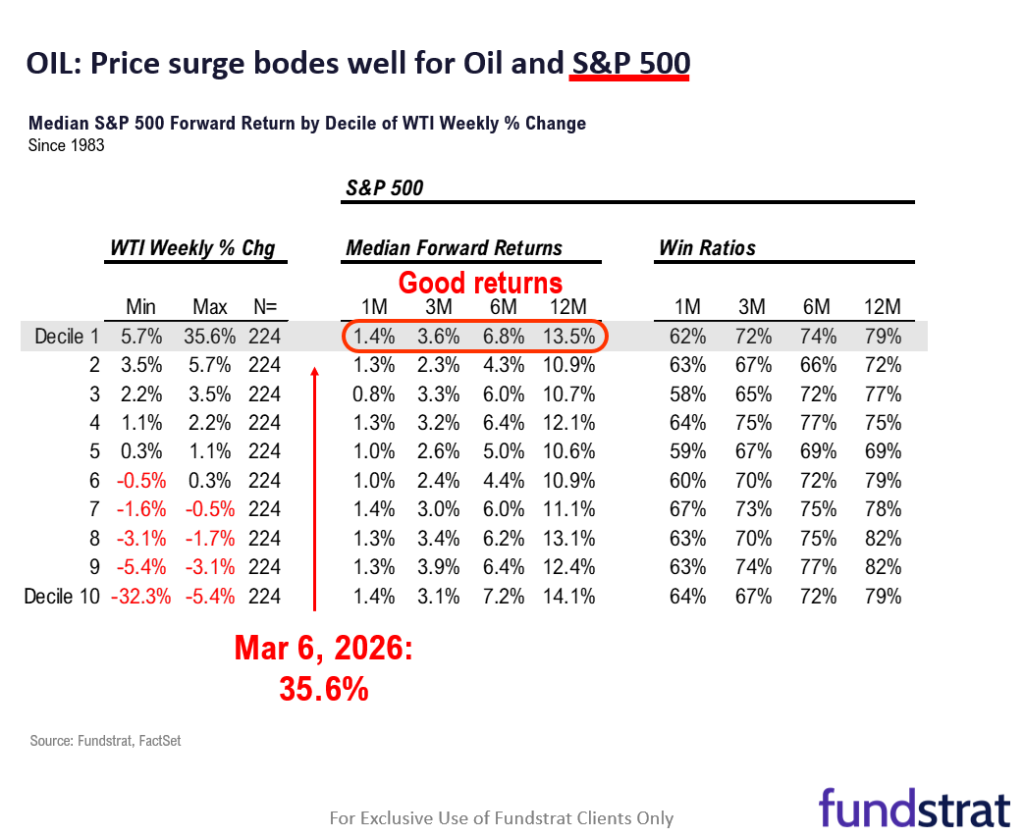
In energy markets, oil prices gave investors whiplash. Last weekend, prices for Brent crude, the international oil benchmark, rose to over $115 a barrel, but pared those gains over the course of the week. On Friday, oil prices settled at $100 a barrel, but remained up nearly 40% since the U.S.-Israeli strike on Iran

Attacks on ships in the Strait of Hormuz and the threat of attacks led to the disruption of oil supply. The International Energy Agency on Wednesday said it will release oil from its reserves to improve supply in the near term. 

Fundstrat Head of Technical Strategy Mark Newton said during the weekly huddle that “we had a substantial rally in most parts of energy, and now they’re starting to fade. That’s a sign that we’re seeing exhaustion signals in many parts of energy,” he said. 

To some extent, the energy sector’s fortunes are closely tied with that of the duration of the war. Conflicting information from the White House about the length had confused investors earlier in the week. Bets on Polymarket show that traders now expect the war to go for longer, Head of Research Tom Lee pointed out. 

Even in that scenario, Lee believes that higher oil can be good for U.S. stocks. “Higher oil is actually good for the U.S. economy, in aggregate” he said. 

There’s four reasons for that. First, the U.S. is a net exporter of oil. Second, China and other countries in Asia along with Europe are much dependent on oil flows out of the Strait of Hormuz compared to the U.S. Third, higher oil poses global growth risks, which favors rotation into growth stocks that the U.S. has plenty of. Indeed, tech stocks fell less than the broader market this week. 

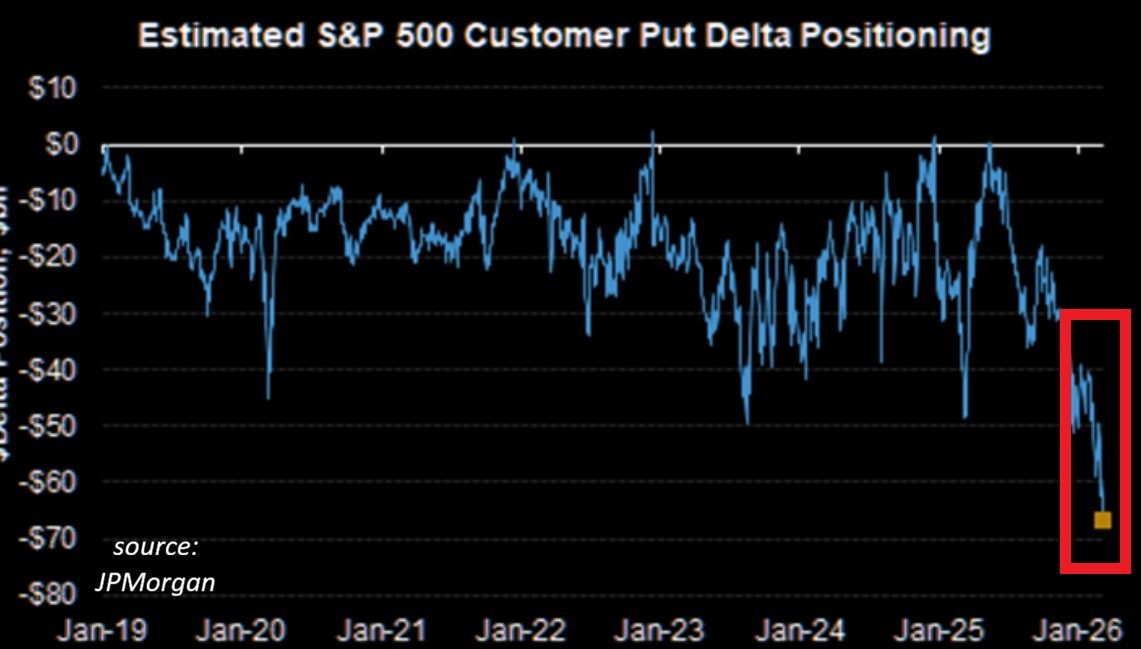
Fourth, Lee said that higher oil will filter into core inflation eventually, putting the Trump put into play. Higher gasoline is not popular and the midterm elections will have sway, favoring a shorter conflict. “When markets feel so much pain, we’ve got the Trump put,” he said. 

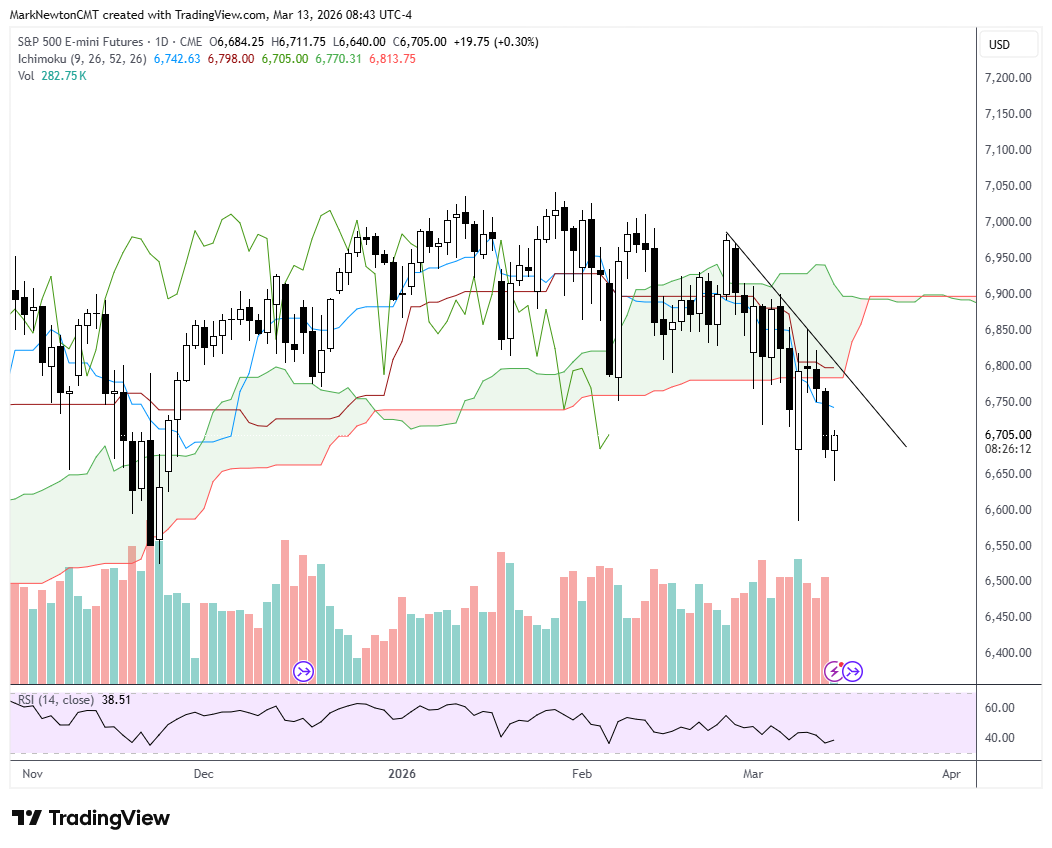
Newton remains bullish on stocks in the near term. 

“I think for the time being, things are OK, “ he said. “I don’t think we’ve seen that much total weakness in equities despite various parts of the market having been hit very hard. My own sense is that we’re setting up for a rally up to near 6,950, and after that, I think we could be in for sort of a rough April.” 

 
Stocks Post Third Straight Week of Losses

Chart of the Week

Stocks Post Third Straight Week of Losses

Fundstrat Head of Research Tom Lee also conducted analysis that showed that when oil has suddenly spiked, stocks typically rise, so he expects March to be an up month. Our Chart of the Week has more details. In economic data, the consumer-price index in February rose 2.4% from a year ago, coming in line with expectations. The GDP report on Friday showed that the economy grew at a 0.7% annual rate in the fourth quarter of last year, which was slower than expected. The crucial data points came ahead of the Federal Reserve meeting next week. 

Recent ⚡ FlashInsights

Today’s economic data showed annual headline PCE coming in slightly below estimates, pointing to a benign inflation picture before the start of the war in Iran. Core PCE MoM was 0.4%, inline while YoY comes in 3.1%. But much of the other data came in on the weak side, GDP annualized QoQ proved much lower at 0.7% vs. 1.4% and Consumption, Capex, and net exports all worse than expected. Yields have pulled back from yesterday’s spike on 2Yr, while Oil is paring gains, and S&P futures are higher by +0.41%, or +28 pts. The early morning reversal from lows at 6640 to current 6704 is a positive and should lead up to 6740 initially, with 6800 being a stronger level of near-term resistance
Mar 13 · 9:32 AM
My view is that a rally back to fill this morning gap should be underway which initially challenges 6759 and then eventually leads to a minor breakout and could help SPX push higher to 6950. Today’s market breadth remains about 3/1 negative with greater than 1% losses in Comm. Svcs, Discretionary, Healthcare, Industrials, Technology, and Financials. However, Utilities, Energy and Materials are positive in today’s session as many of the Chemical and Grain-related names show very good strength within the Materials sector.
Mar 12 · 2:06 PM
US indices largely have traded range-bound since this morning’s open gap lower but its’ thought that this stabilization should pave the way for higher prices over the next week. Not only have implied volatility gauges diverged from SPX 1-month realized volatility but there’s been evidence of investors shorting macro and ETF’s expecting a selloff. This chart shows the Put delta positioning which indicates extreme hedging activity (From JP Morgan) and it’s likely that this probably won’t materialize as easily as investors expect.
Mar 12 · 2:06 PM

FS Insight Video: Weekly Highlight

Key incoming data

  • 3/9 11:00 AM ET: Feb NYFed 1yr Inf Exp Tame
  • 3/10 6:00 AM ET: Feb Small Business Optimism Survey Tame
  • 3/10 10:00 AM ET: Feb Existing Home Sales Tame
  • 3/11 8:30 AM ET: Feb Core CPI MoM Tame
  • 3/12 8:30 AM ET: Jan Trade Balance Tame
  • 3/13 8:30 AM ET: 4Q S GDP QoQ Mixed
  • 3/13 8:30 AM ET: Jan P Durable Goods Orders MoM Tame
  • 3/13 8:30 AM ET: Jan Core PCE MoM Tame
  • 3/13 10:00 AM ET: Jan JOLTS Job Openings Tame
  • 3/13 10:00 AM ET: Mar P U. Mich. 1yr Inf Exp Tame
  • 3/16 8:30 AM ET: Mar Empire Manufacturing Survey
  • 3/16 10:00 AM ET: Mar NAHB Housing Market Index
  • 3/18 8:30 AM ET: Feb Core PPI MoM
  • 3/18 10:00 AM ET: Jan F Durable Goods Orders MoM
  • 3/18 2:00 PM ET: Mar FOMC Decision
  • 3/18 4:00 PM ET: Jan Net TIC Flows
  • 3/19 8:30 AM ET: Mar Philly Fed Business Outlook
  • 3/19 10:00 AM ET: Jan New Home Sales
Stocks Post Third Straight Week of Losses

Stock List Performance

Stocks Post Third Straight Week of Losses

In the News

Tom Lee: Nvidia at 19x PE. Is the Market Getting It Wrong?

Tom Lee: Nvidia at 19x PE. Is the Market Getting It Wrong?

logo image
Tom Lee: Supreme Court Ruling. What It Means for Investors

Tom Lee: Supreme Court Ruling. What It Means for Investors

logo image
AI wreaking havoc across software stocks, job losses might follow: Tom Lee

AI wreaking havoc across software stocks, job losses might follow: Tom Lee

logo image
More News Appearances

Disclosures (show)

Events

Trending tickers in our research