Stocks posted weekly losses, with investors no longer able to look past the double hit of higher government bond yields and oil prices. The S&P 500 lost 0.8% this week, with nine of the 11 sectors in the red. Only energy and communication services finished in the green. The broad-based index is off 1.8% from its all-time highs hit about a month ago.
Since yields on longer-dated government bonds started climbing in late August, stocks have surprisingly held their own, but it seems like this week a new pressure point was hit. The 10-year Treasury yield rose to 4.969% on Thursday, the highest level since October 2023’s 4.989%.
Treasury Secretary Scott Bessent has been trying hard to rein in the longer-dated yields. On Wednesday, the Treasury Department announced that it will buy back $6 billion of longer-dated bonds.
There was no relief on the oil front, either. U.S. crude oil prices jumped past the $100 a barrel mark on Thursday, which hasn’t been seen since May. That’s why this week’s consumer-price index report was so closely watched. On Friday, it showed that headline inflation in August rose 3.4% from a year ago, coming in line with expectations, but core inflation increased 0.3% from a month ago, which was higher than economists were expecting. The odds of a hike at the Fed’s meeting next week shot up past 85%, up from 59% a week ago, according to CME’s FedWatch tool.
Fundstrat Head of Research Tom Lee, however, is still of the view that the Fed will hold. Lee said a “face-ripper” rally could be imminent after the inflation data. If Friday’s performance is any guide, that prediction could turn out to be true. The S&P 500 added 0.9%.
He is sticking to his top picks: crypto, energy, and downstream AI trades like the Magnificent Seven, software, and ethereum. He also likes small caps.
Head of Technical Strategy Mark Newton expects there will be some relief in the bond market and in crude prices over the next 3-5 days. He expects that will coincide with markets turning back higher. Newton has been keeping a close eye on the nascent declines in the consumer discretionary, healthcare, and financials sector, while tech has recovered.
“The fact that tech is strong is great, but all these other groups are falling, so it’s weighing on near-term market breadth,” he said during the weekly huddle. “You’ve seen a little bit of a backing and filling, but I don’t think it’s really all that meaningful overall.”
Chart of the Week
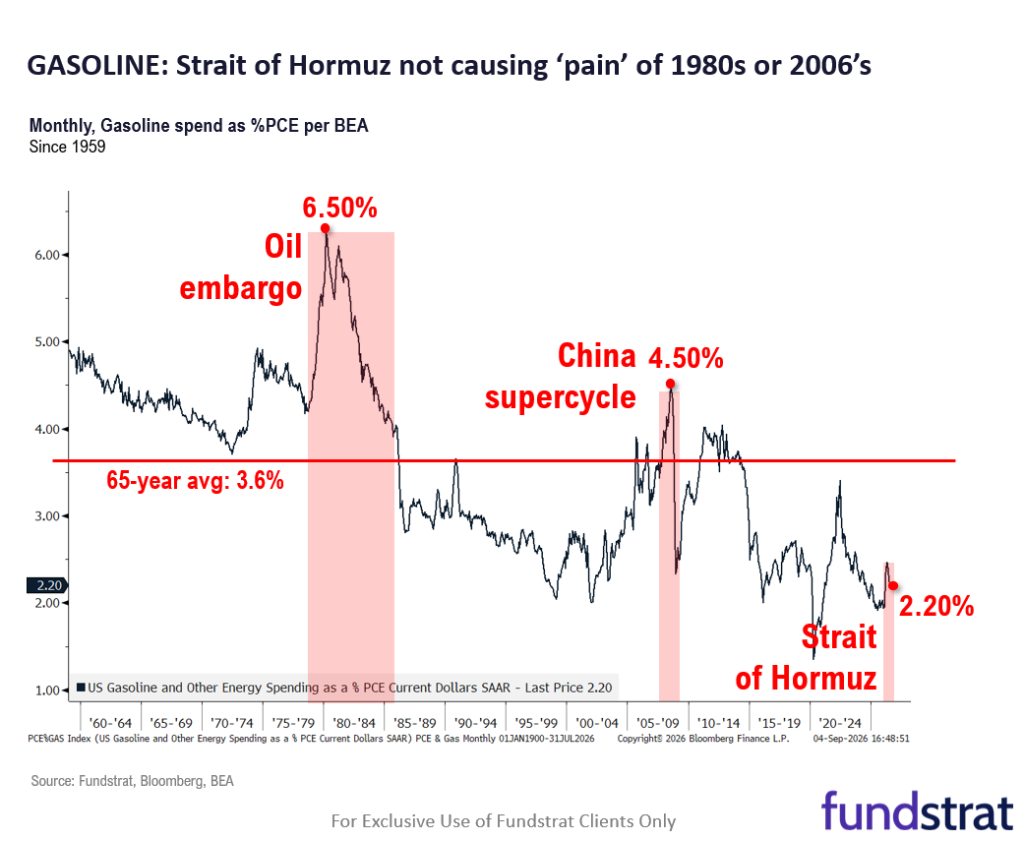
A reason why Fundstrat Head of Research Lee believes that gasoline prices aren’t as bad as they’ve been during previous turbulent periods. “In the 1980s during the oil embargo, gasoline was 6.5% of your wallet. During the run-up into the global financial crisis with the China supercycle, it got to 4.5%, and with the Iran war, it’s sitting at 2.2%, so I still think the odds are toward no hike,” he said. Our Chart of the Week has more details.
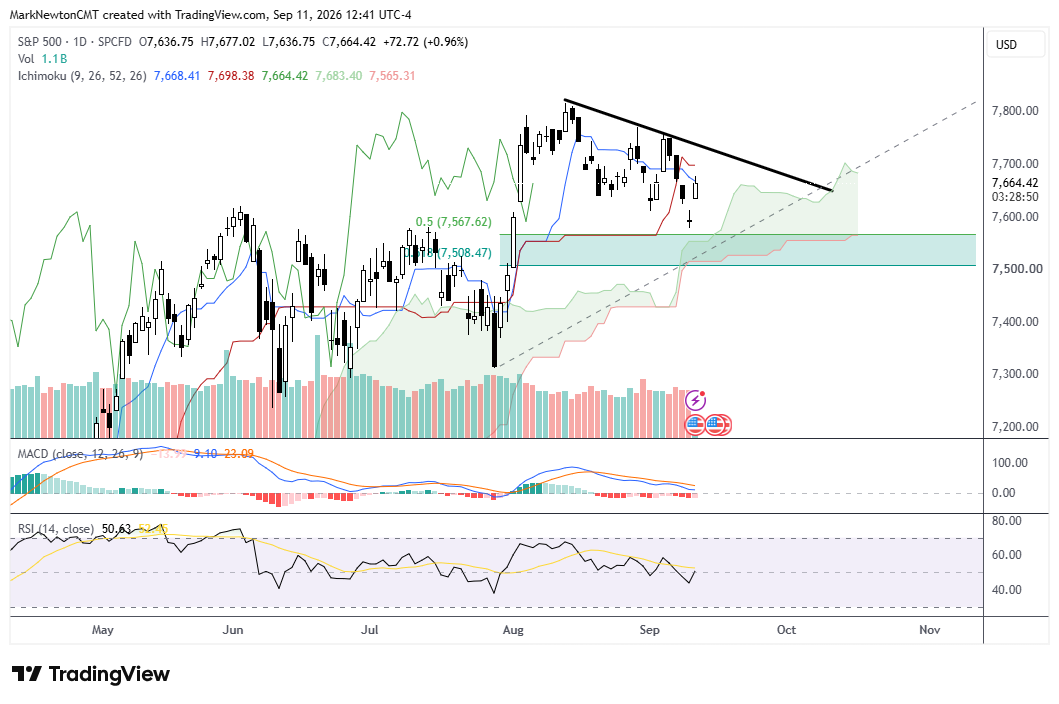
As much as I’d like to say yesterday’s lows were “the low” of the recent consolidation, neither ^SPX 0.86% nor QQQ 0.88% have made sufficient progress yet off the lows to be able to make that call. Additionally, the selloff from 9/3 down to 9/10 over the last four days is just one leg of this “final” pullback, and ideally, there would be at least a retest that could get under yesterday’s lows by a small amount. In plain English, while lows are close, i can’t yet say we’re there and there might be the need for 1-2 days of weakness before a more meaningful low is at hand (which would complete the final ABC-type correction) ^SPX 0.86% bounce found initial resistance near 7677 and ideally for trend following purposes 7756.76 needs to be exceeded to allow for upside acceleration. Thus SPX price is roughly mid-way between the high and low of the recent four-day pullback, and while an encouraging bounce, a bit more needs to happen to gain conviction, specifically for ^SPX 0.86% and QQQ 0.88% . The daily chart of ^SPX 0.86% is shown below highlighting today’s bounce as part of the existing consolidation. Market breadth is 2/1 positive, but keep in mind it was -3/1 negative over the last couple days. Technology is the clear outperformer today, and i suspect that continues, with some encouraging price action today out of DELL 11.81% , HPE 12.39% , HPQ 8.40% , SWKS 5.14% , ON 8.44% , CDW 7.85% , and NTAP 8.54% all up more than 5% today.
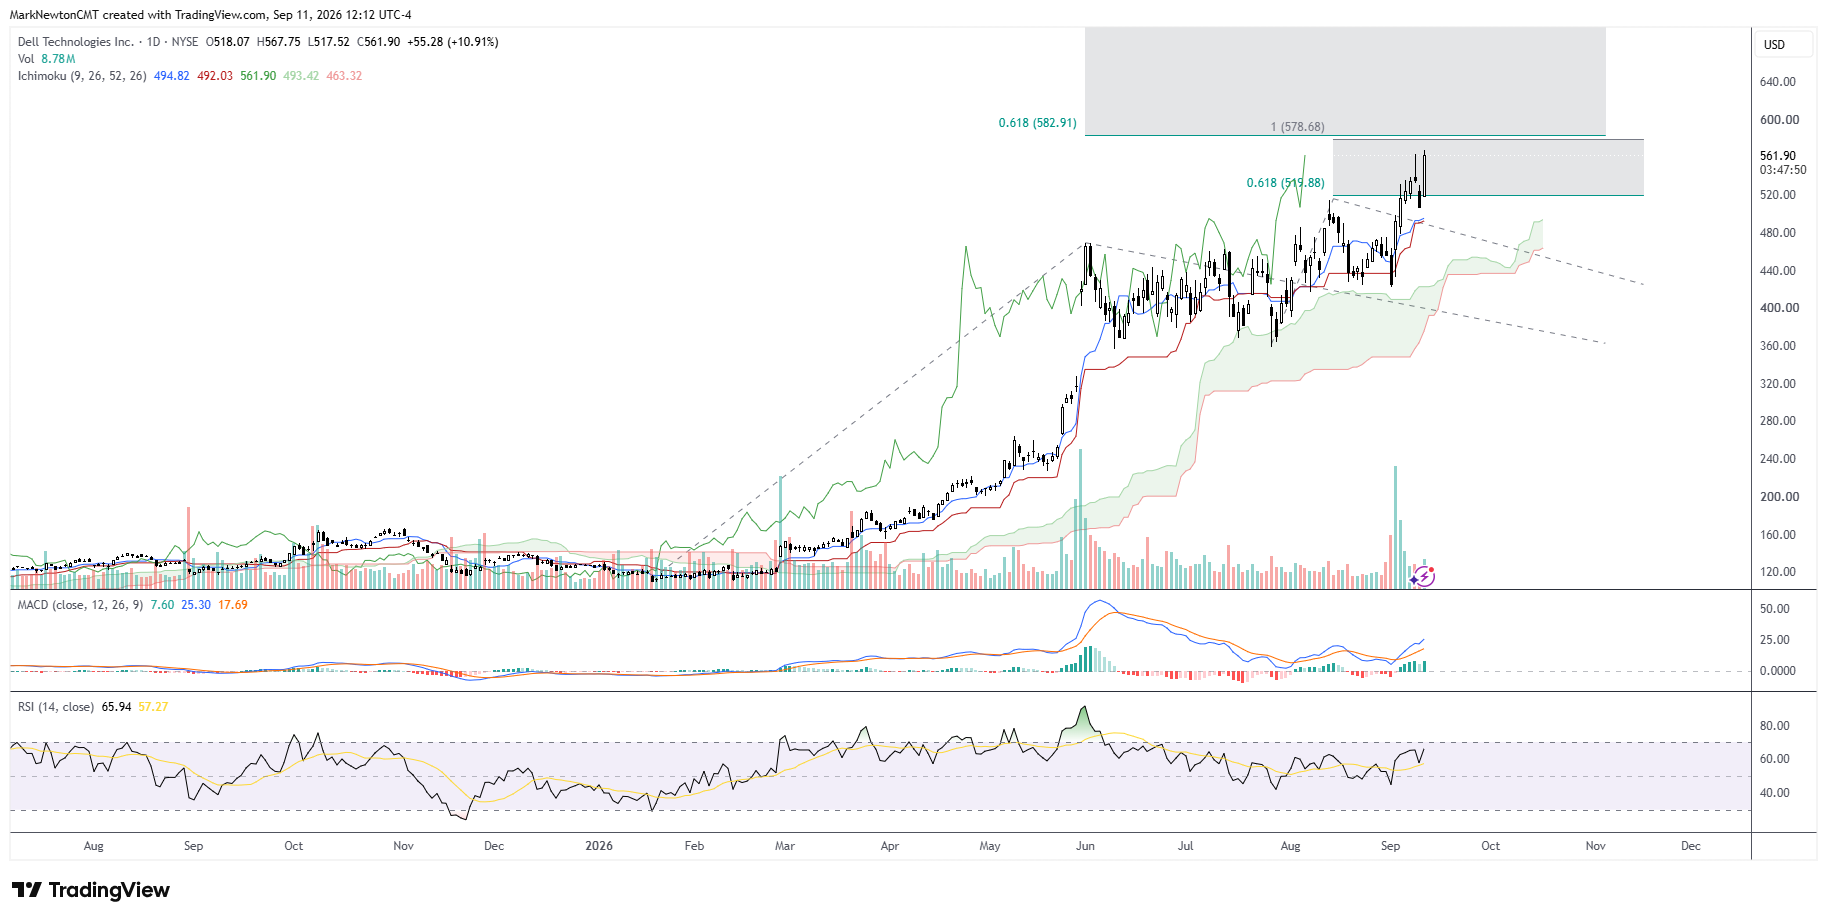
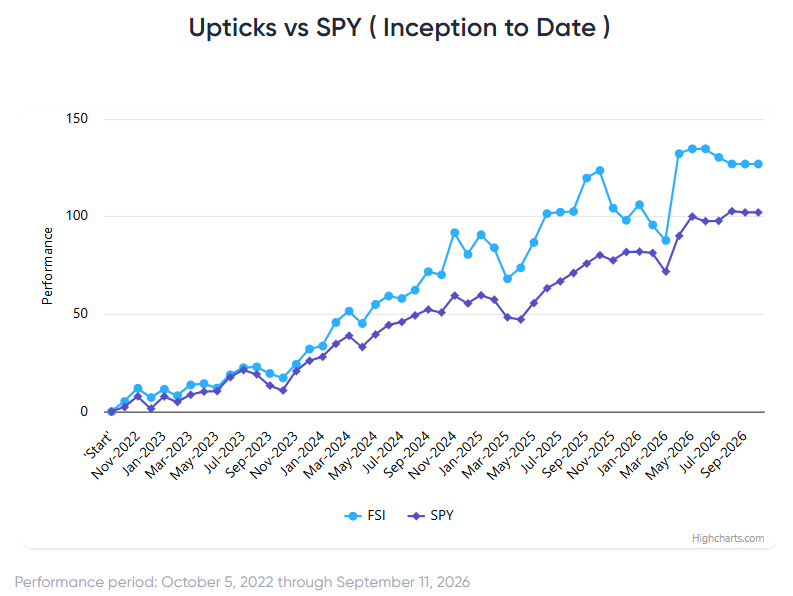
DELL 11.81% strength has carried this back to all-time highs today as part of a larger monthly breakout of the sideways three-month consolidation from mid-June. DELL is the #1 performer in ^SPX 0.86% , higher by more than +10.7%. While weekly and monthly momentum are overbought, the period from June-September helped to lessen the overbought state of this stock and today’s move is a clear positive, technically and this surge is part of the breakout process this month following three months of dormancy. Overall, i expect this to push up to near-term resistance at $580 which is a short-term target. Thereafter, my analysis shows an intermediate-term target to be $719. DeMark’s monthly charts show some possible stalling out in October. However, today’s move should lead to more upside and this will continue to be a part of my U 0.54% pticks list. Support is $503 and $492 and until this starts to show evidence of technical deterioration, minor weakness should be used to buy.
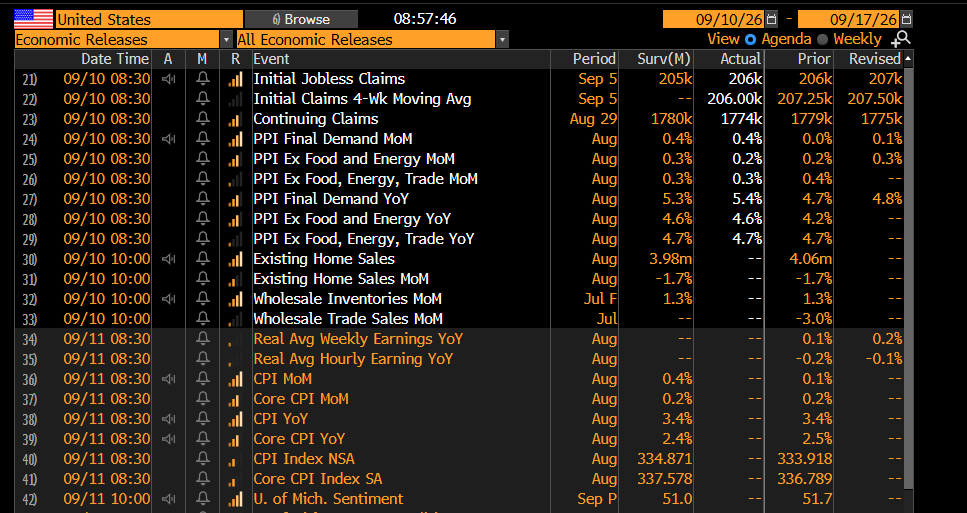
PPI data largely came in In-Line with forecasts.. a slight decline in MoM data 0.2% vs. 0.3% while prior month was revised higher by an equal amount so as to cause the YoY data to be in-line with the Consensus forecast. (Keep in mind that this data is only through 8/10 so it doesn’t factor in the gains in Crude of the last month) Fed fund futures are now factoring in a 70% chance of a rate hike, up from 60% and now two hikes are priced in by January 2027. ECB also hiked rates by 25 bps this am, and both 2 and 10-yr yields are climbing so not much change in the Yield curve. WTI Crude has pressed up over $100 in the October contract, but arguably both Yields and Crude are very close to resistance where it might be unlikely to see much further gains. Equity futures are lower by -0.50% on S&P and -1.25% on Nasdaq with S&P now quite close to near-term support which i suspect happens between now and Friday and TNX has eclipsed 4.9% and within striking distance of 5% which was hit back in October 2023 and thought to be important. Below is the economic data for this morning for US.
This research is for the clients of Fundstrat Direct only. Fundstrat Direct Subscription entitles the subscriber to 1 user, research cannot be shared or redistributed. For additional information, please contact your sales representative or Fundstrat Direct at fundstratdirect.com.
Conflicts of Interest
This research contains the views, opinions and recommendations of Fundstrat Direct. At the time of publication of this report, Fundstrat Direct does not know of, or have reason to know of any material conflicts of interest.
General Disclosures
Fundstrat Direct is an independent research company and is not a registered investment advisor and is not acting as a broker dealer under any federal or state securities laws.
Fundstrat Direct is a member of IRC Securities’ Research Prime Services Platform. IRC Securities is a FINRA registered broker-dealer that is focused on supporting the independent research industry. Certain personnel of Fundstrat Direct (i.e. Research Analysts) are registered representatives of IRC Securities, a FINRA member firm registered as a broker-dealer with the Securities and Exchange Commission and certain state securities regulators. As registered representatives and independent contractors of IRC Securities, such personnel may receive commissions paid to or shared with IRC Securities for transactions placed by Fundstrat Direct clients directly with IRC Securities or with securities firms that may share commissions with IRC Securities in accordance with applicable SEC and FINRA requirements. IRC Securities does not distribute the research of Fundstrat Direct, which is available to select institutional clients that have engaged Fundstrat Direct.
As registered representatives of IRC Securities our analysts must follow IRC Securities’ Written Supervisory Procedures. Notable compliance policies include (1) prohibition of insider trading or the facilitation thereof, (2) maintaining client confidentiality, (3) archival of electronic communications, and (4) appropriate use of electronic communications, amongst other compliance related policies.
Fundstrat Direct does not have the same conflicts that traditional sell-side research organizations have because Fundstrat Direct (1) does not conduct any investment banking activities, and (2) does not manage any investment funds.
This communication is issued by Fundstrat Direct and/or affiliates of Fundstrat Direct. This is not a personal recommendation, nor an offer to buy or sell nor a solicitation to buy or sell any securities, investment products or other financial instruments or services. This material is distributed for general informational and educational purposes only and is not intended to constitute legal, tax, accounting or investment advice.
The statements in this document shall not be considered as an objective or independent explanation of the matters. Please note that this document (a) has not been prepared in accordance with legal requirements designed to promote the independence of investment research, and (b) is not subject to any prohibition on dealing ahead of the dissemination or publication of investment research.
Intended for recipient only and not for further distribution without the consent of Fundstrat Direct.
This research is for the clients of Fundstrat Direct only. Additional information is available upon request. Information has been obtained from sources believed to be reliable, but Fundstrat Direct does not warrant its completeness or accuracy except with respect to any disclosures relative to Fundstrat Direct and the analyst’s involvement (if any) with any of the subject companies of the research. All pricing is as of the market close for the securities discussed, unless otherwise stated. Opinions and estimates constitute our judgment as of the date of this material and are subject to change without notice. Past performance is not indicative of future results. This material is not intended as an offer or solicitation for the purchase or sale of any financial instrument. The opinions and recommendations herein do not take into account individual client circumstances, risk tolerance, objectives, or needs and are not intended as recommendations of particular securities, financial instruments or strategies. The recipient of this report must make its own independent decision regarding any securities or financial instruments mentioned herein. Except in circumstances where Fundstrat Direct expressly agrees otherwise in writing, Fundstrat Direct is not acting as a municipal advisor and the opinions or views contained herein are not intended to be, and do not constitute, advice, including within the meaning of Section 15B of the Securities Exchange Act of 1934. All research reports are disseminated and available to all clients simultaneously through electronic publication to our internal client website, fundstratdirect.com. Not all research content is redistributed to our clients or made available to third-party aggregators or the media. Please contact your sales representative if you would like to receive any of our research publications.