


Please CLICK HERE to download the sector allocation report in PDF format.
MARKET RECAP
As the first nine months of the year came to a close, the S&P 500 was up 11.8% for the year. Our base-case, full-year outlook for 2026, which had called for a three-phase market this year, remains intact.
The S&P 500 slipped a modest 0.45% in September. We had entered September believing that stocks would defy the typically challenging seasonality of the month and advance. Though we admit to a certain disappointment that the broad-based index did not notch gains in September, we are also encouraged by the market’s resilience in the face of major headwinds that arose.
The Federal Reserve and the 10-year Treasury yield
Stocks were pressured all month by a historic rise in yields, which was kickstarted by Federal Reserve Chair Kevin Warsh’s remarks at the Jackson Hole Economic Symposium on Aug. 28. Though yields had edged up gradually throughout most of the year, they surged in earnest after his speech. By Sept. 14, they had breached the key psychological 5% level.
Then came the Federal Open Market Committee meeting on Sept. 16, when the FOMC hiked rates by 25-basis points, to a target range of 3.75%-4.00%. Perhaps more notably, the Summary of Economic Projections released at the end of the meeting indicated that the median anticipation of FOMC members was for at least one more rate hike before the year is out. Yields saw another surge soon afterwards.
By Sept. 30, the 10-year yield had climbed to 5.29%.
It’s reasonable to describe the stance taken by Fed Chair Kevin Warsh and the FOMC as “max hawkish.” Though there are many paths Warsh and the Fed could have chosen on Sept. 16, we believe it’s fair to say that, metaphorically speaking, the Fed “chose violence.”
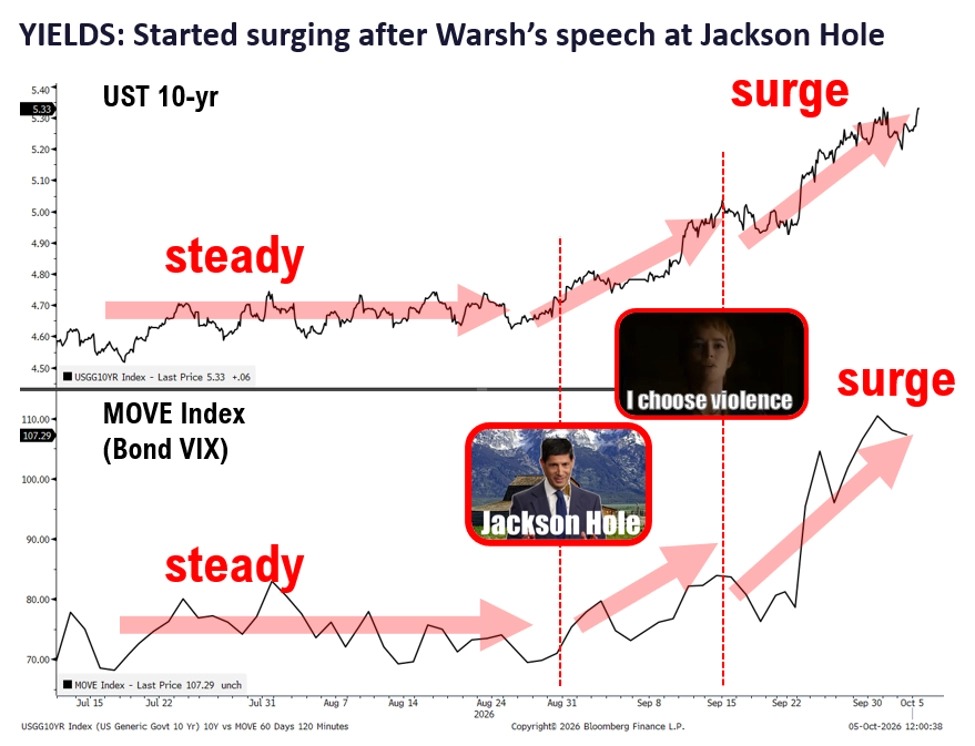
To us, the chart above shows that yields were actually fine until the Fed said they had a problem with inflation, and then yields and bond volatility suddenly moved very dramatically. Many observers interpreted this reaction as a demand by the market to bring inflation under control more quickly with a rate hike. Ultimately, we believe that markets bullied the Federal Reserve into raising rates.
The implications for investors
We view the FOMC’s move as contributing to a bullish setup in October and subsequent months. However, to explain why, we need to discuss why we disagree with the FOMC’s decision.
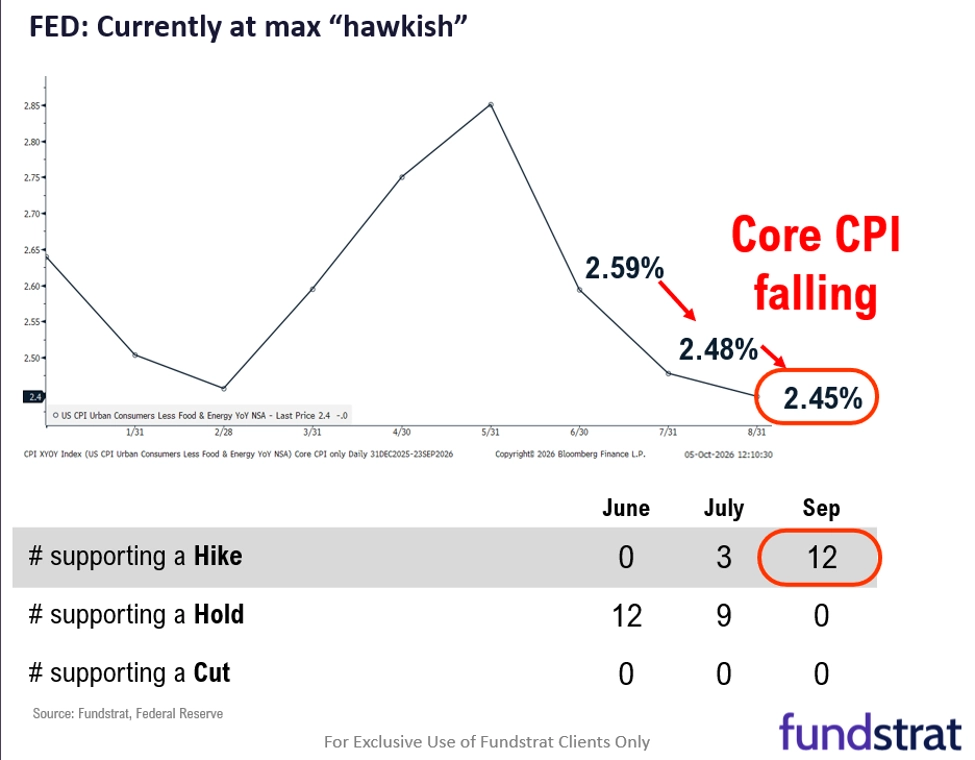
As Chair Warsh noted after the meeting, this decision was largely motivated by inflation-related concerns. Thus, it is curious that in June, when core CPI was at 2.59% year-over-year, 12 members voted to hold. Yet in July, when annual core CPI fell to 2.45%, three members changed their minds and voted to hike. Furthermore, with annual core CPI falling further to 2.4% in September, all 12 members voted to hike.
Admittedly, the Fed’s preferred inflation metric, core PCE, has diverged from the downward path of core CPI. We view Core PCE as likely to come in lower going forward, in part due to a new methodology that corrects for the stock-market distortion of asset management fees and the effects of memory prices on computer accessories, among other things. The new methodology came into effect on Sept. 30, when core PCE for August was released, and the metric is already showing declines: it came in at 3.0%, down from the previous month’s original 3.3% reading.
It is hard to see how the Fed could get even more hawkish than it did in September, and as the Fed itself has acknowledged in the past, monetary policy can take six months or more to take effect. Thus, we believe markets arguably will react positively to any dovish developments before then. In fact, the recent core PCE and jobs reports have reinforced this view, with both coming in on the dovish side. At this point, an October rate hike is largely off the table. We also anticipate that “Fedspeak” could start shifting dovishly.
The implications of 5% yields
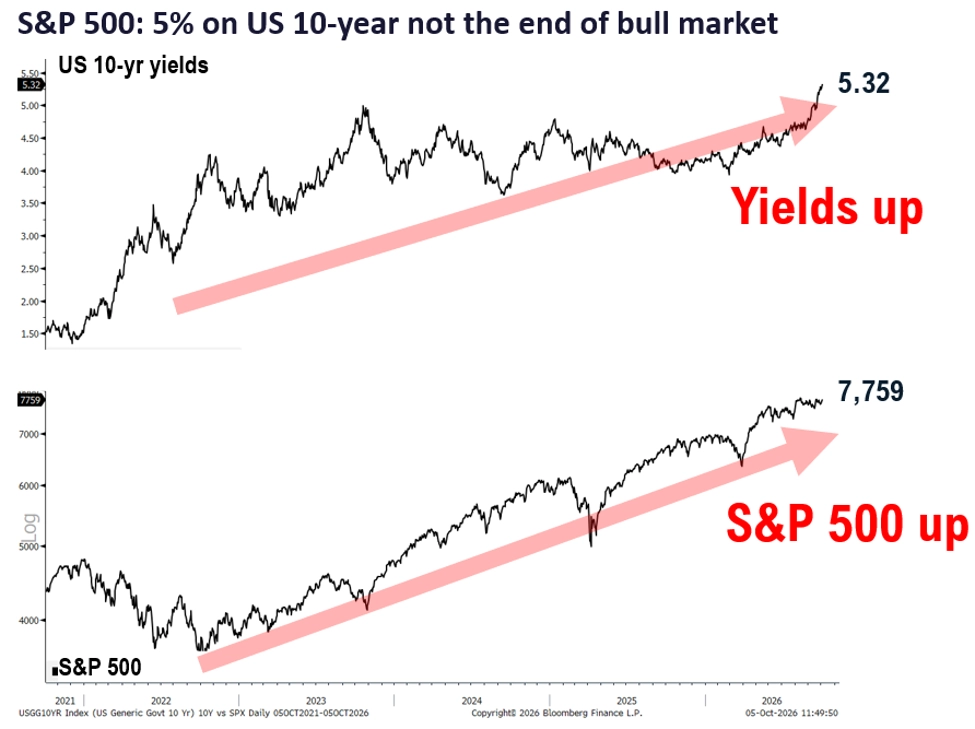
As for yields, we acknowledge that 5% is a big level. Yet historically, a 5% 10-year yield has not necessarily meant the end of a bull market. Over the past five years, rising yields and the S&P 500 have actually moved together. In fact, as the chart below shows, the last time yields touched 5% was in October 2023, and this actually coincided with the end of a selloff and the beginning of a rally.
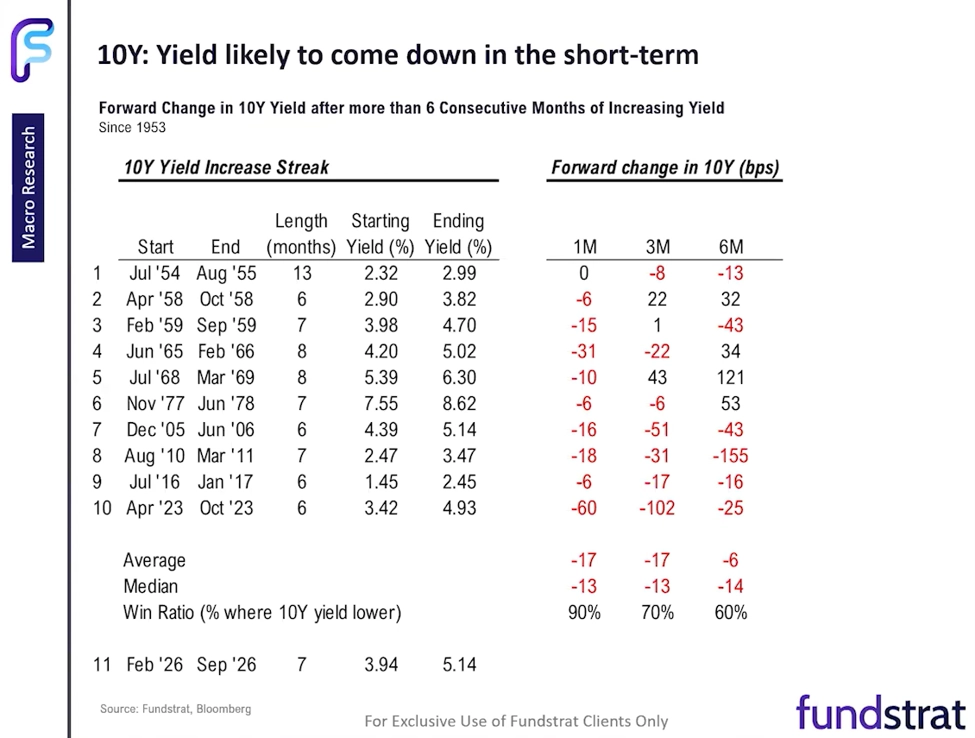
We also view it as constructive that as of September, yields have risen consecutively for seven straight months (though as we noted earlier, the bulk of the surge came after Fed Chair Warsh’s remarks at Jackson Hole). Yields have only climbed six or more consecutive months in a row 10 times since 1953. In these historical precedents, yields have generally fallen one, three, and six months later. If this precedent holds, it could also provide a tailwind for stocks.
Earnings
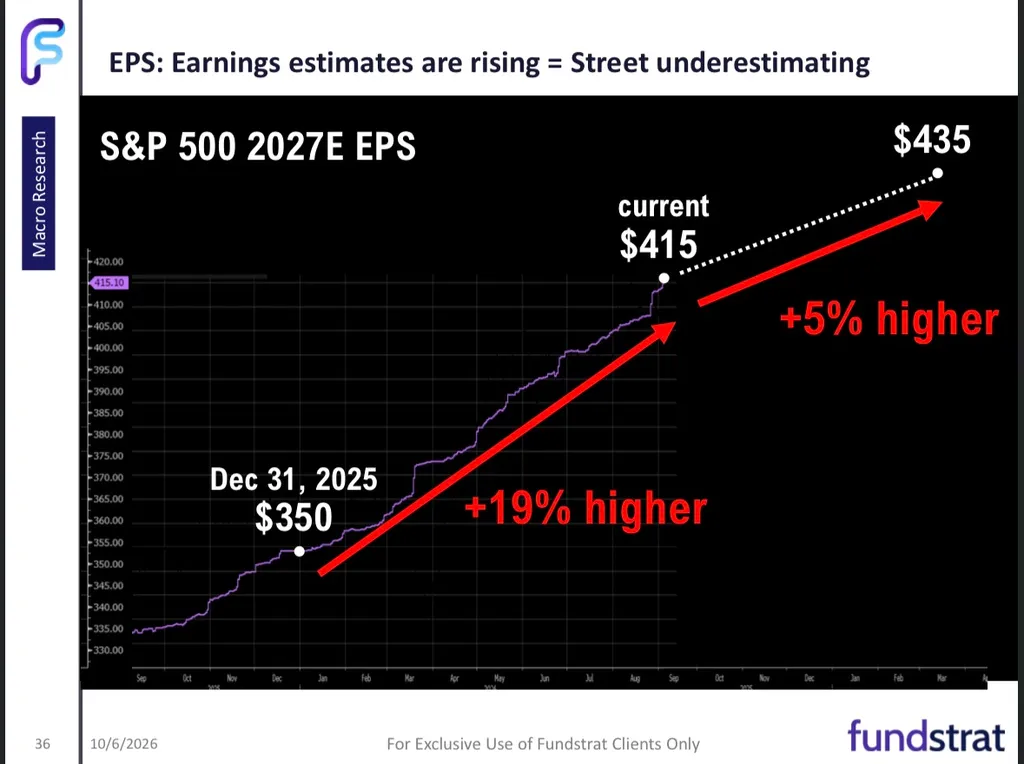
From a fundamental perspective, we continue to see potential upside for the broader S&P 500. Since the end of 2025, 2027E S&P 500 EPS has gone up roughly 19%, from $350 to $415. We see it as ultimately heading up another 5% to $435.
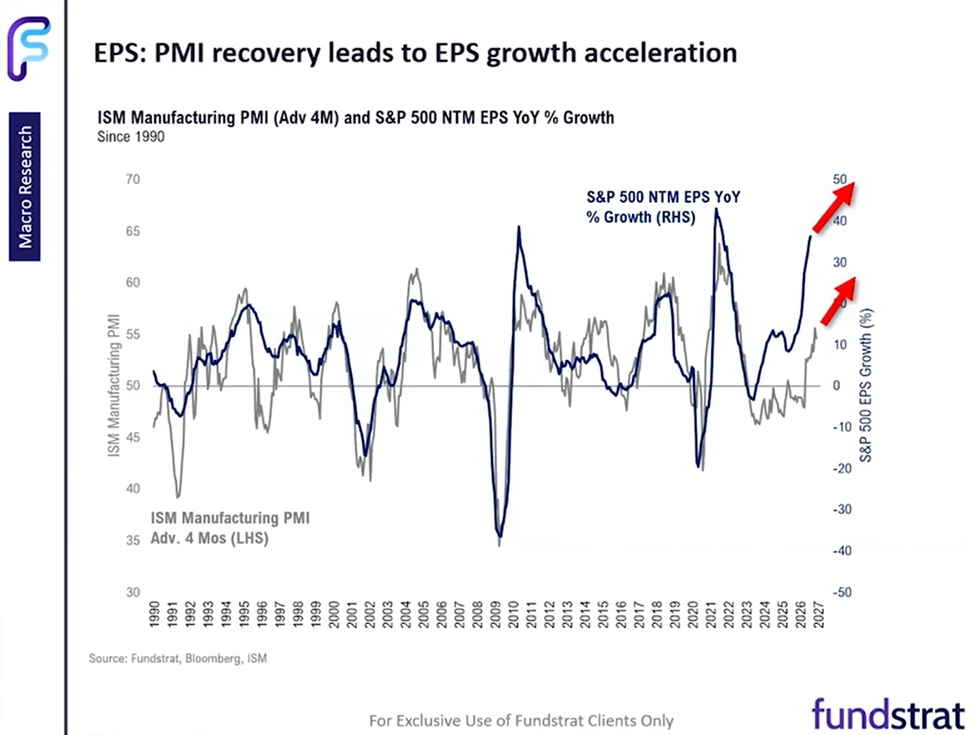
This is linked to ISM Manufacturing PMI finally staying above 50 after languishing below that mark for roughly three years – incidentally, the longest stretch since 1948. Historically, such moves have been correlated with earnings growth. As we see below, this is happening again. Though earnings had been growing even before ISM PMI turned above 50, we are now seeing an acceleration.
Midterms could cause short-term volatility
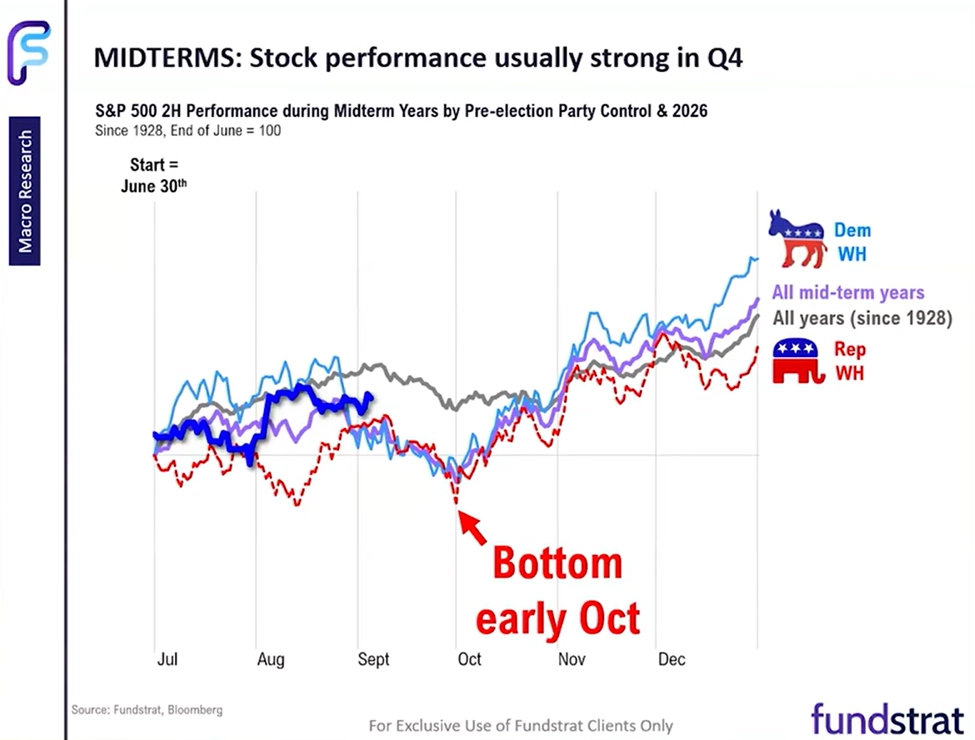
However, in the immediate term, we anticipate some turbulence related to the midterm elections that will take place on Nov. 3, 2026. Prediction markets currently suggest that the Democrats could take over control of both the House and the Senate. However, beyond that, midterm-related volatility has historically been more of a seasonal factor. As the chart below shows, under both Democratic and Republican presidents, midterm elections (typically taking place in the beginning of November) have typically been followed by stock-market gains.
Nor does it seem that a change in power will impact our thesis significantly. Currently, Democrats oppose the expansion of data centers and the cryptocurrency-related Clarity Act, but this opposition appears to be largely based on political considerations rather than the issues themselves. Thus, we believe that the net political situation will largely remain unchanged after the midterm elections, with the two parties flipping stances. Our view is that markets will continue this historical trend and rally after the midterm elections.
Conclusion
We realize investors feel worn down by the churning in the month of September. There were multiple negative macro developments during the past month. However, the headwinds are expected to be less severe in October, and often in markets “less bad is good.” With underlying fundamentals remaining solid and investor sentiment at cautious levels, we believe that the setup for October features attractive risk-reward.
Sector Allocation Update
Strategic Sector Ratings
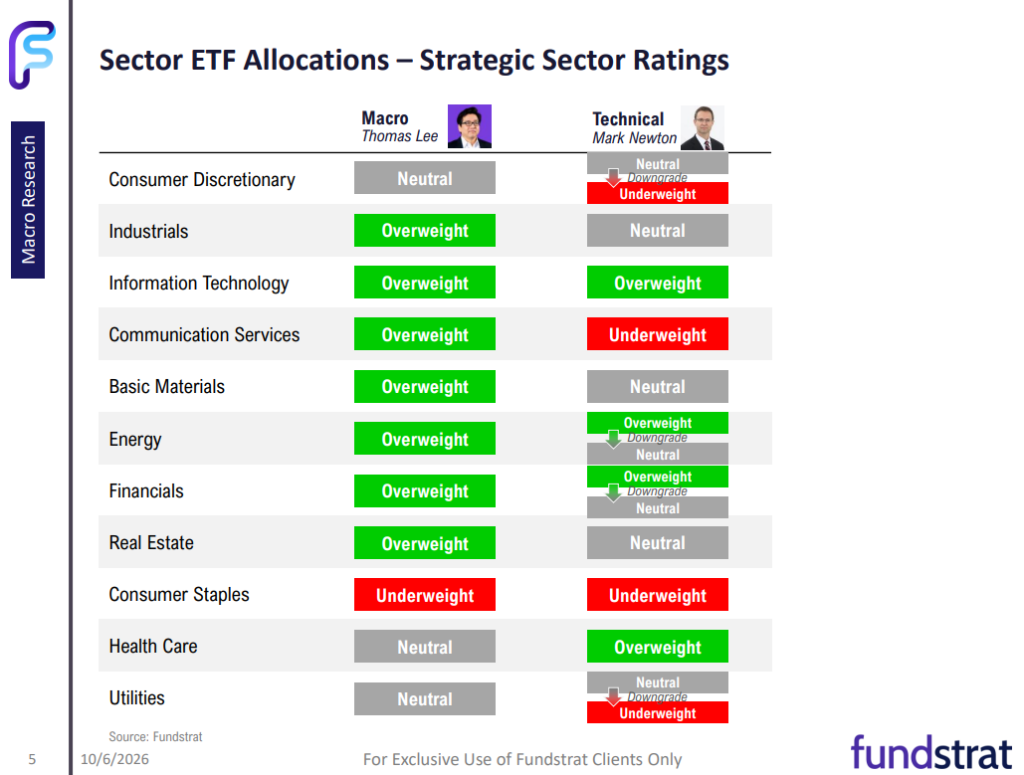
For October, Tom’s ratings remain unchanged as usual, while Mark made several adjustments, downgrading four sectors at once heading into 4Q.
- Energy: Overweight —> Neutral.
- Financials: Overweight —>Neutral.
- Consumer Discretionary: Neutral —> Underweight.
- Utilities: Neutral —> Underweight.
Energy (Overweight to Neutral):
Last month Mark lifted Energy two notches to Overweight. One month later, he is moving it back to Neutral. The ratio of equal-weight Energy to the equal-weight S&P 500 (RSPG/RSP) rallied from 0.47 in August to 0.55 in mid-September. That peak lined up with a weekly TD Sequential 13 sell signal. The ratio has since slipped to 0.52 and broken its uptrend from the August lows.
Crude cooled at the same time. October WTI futures fell more than 10% in six sessions, from 106.75 to 94.59. Mark had already removed VLO from his Upticks list in mid-September because the refiners were stretched. He expected the relative ratio to pull back to 0.50 to 0.51 before it could resume higher. November WTI is now breaking its uptrend from the last couple of months and its May peaks. Crack spreads are also coming down. Mark plans to stay Neutral on Energy into late November or December. He sees possible weakness between now and year-end as the time to buy the sector again. Energy was flat on an absolute basis since the last update and lagged the S&P 500 by 0.7%.
Financials (Overweight to Neutral):
The ratio of equal-weight Financials to the equal-weight S&P 500 (RSPF/RSP) peaked near 0.39 in early September. That peak came with a TD Sequential 13 sell signal. The ratio then broke its uptrend from the June lows and undercut TDST support at 0.38. A recapture of 0.38 is needed before Financials can provide a tailwind again.
In September, Mark flagged trendline support and called dips buyable. But recently, his near-term view was more cautious. He thinks Financials are still at least two weeks from a relative bottom. He does not expect the sector to beat the equal-weight S&P 500 before the midterms. RSPF could slip from 78 to about 73, a decline of roughly 5%. However, there are positives: 1\ the 2s10s curve has steepened on growth, and 2\ credit spreads have started to narrow. A break above 55 basis points on 2s10s would help banks and brokers. Mark still likes the sector on an intermediate-term basis. It is just not a one-month pick. Financials fell 7.1% since the last update, the worst in our coverage and none of its members are above their 20-day moving average.
Consumer Discretionary (Neutral to Underweight):
Mark made this call on September 29 as the equal-weight Discretionary relative to the equal-weight S&P 500 (RSPD/RSP) fell below its 2008 and 2020 lows. That is a multi-decade relative low and YTD, the equal-weight Discretionary is the second-worst sector, behind only Communication Services.
Mark wants to see yields retreat before buying the consumer. Most recently, Mark noted the relative turn is still about two weeks early based on his DeMark counts. On an absolute basis, the sector could bounce from here, but he does not expect RSPD to clear 56. For those who must own the sector, he emphasized that it is very important to be selective.
One thing worth noting is that Mark believes Discretionary should start to beat Staples from here. The ratio of equal-weight Discretionary to equal-weight Staples (RSPD/RHS) has pulled back to the uptrend connecting the 2020 and 2022 lows. Weekly DeMark exhaustion is also present. A move back above 1.77 to 1.80 would confirm a relative low.
Utilities (Neutral to Underweight):
Last month we noted that Mark’s view on Utilities had moved well past neutral. This month the rating caught up. The ratio of equal-weight Utilities to the equal-weight S&P 500 (RSPU/RSP) has fallen from 0.43 in April to 0.34. That is its lowest level since January 2024, and weekly MACD remains deeply negative. Utilities move inversely with rates. Mark expects a relative bottom to coincide with a peak in Treasury yields. He has discussed a possible peak in long rates in October or November, but says it is still early. The sector fell 6.7% since the last update and lagged the S&P 500 by 7.4%.
With these changes, Tom and Mark now share the same rating on only 2 of 11 sectors, down from 6 last month. Both are Overweight Technology and Underweight Consumer Staples. And notably, Mark is now overweight only two sectors, Technology and Health Care. In addition, Technology is now the only double Overweight in the model.
Tactical OW/UW: Mark’s Top 3 and Bottom 3 Sector Picks
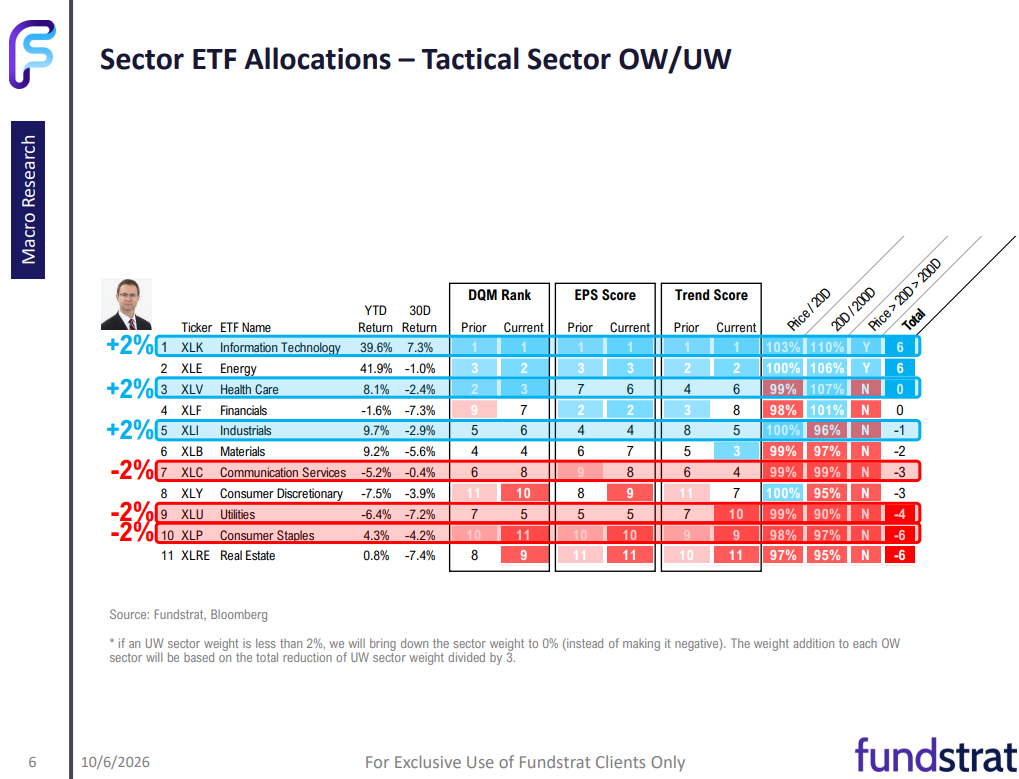
Mark and the quant composite agree at the very top, but not on every pick. The composite’s highest scores belong to Technology and Energy (tied), followed by Health Care, Financials, and Industrials. Mark picks Technology, Health Care, and Industrials. Energy drops out because of the reasons mentioned above within the sector’s downgrade. On the short side, the composite’s lowest scores belong to Real Estate and Consumer Staples (tied), followed by Utilities. Mark picks Staples, Utilities, and Communication Services.
Top 3 Tactical Overweight
- Information Technology: A 2nd straight month in the top 3, now with the strongest case in the table. The sector essentially “carried” the overall market index higher. From the quant perspective, it ranks first on DQM, EPS Score, and Trend Score. On October 1, equal-weight Technology (RSPT) closed at 67.42, a penny above its June high. That completed a breakout from a four-month triangle to new all-time highs. More importantly, the move was broad. Mark expected Tech to lead until at least the middle of next year. He sees this as part of a larger cycle into 2028. He would own Tech in October, but he noted the near-term risk is timing. A weekly TD 13 sell signal on the sector could line up in three to four weeks. That is when he expects Tech to stall and the broader market to pull back 3% to 5% into early to mid-November. But Mark views that pullback as a buying opportunity.
- Health Care: A 5th consecutive month in the top 3. The sector gave back 2.2% since the last update and lagged the S&P 500 by 2.9%. The composite softened. DQM slipped from 2nd to 3rd and Trend Score from 4th to 6th. Still, 68.3% of members remain above their 200-day moving average. Mark’s notes on September 30 and October 1 name Technology and Health Care as the two sectors to favor until Treasury yields peak. Most recently, Mark added a near-term caution and noted the Health Care rally has started to fizzle in the last couple of weeks. Biotech, pharma, and med-tech have all pulled back. He sees this as a short-term consolidation, not a reason to turn negative. He expects the sector to turn back up in about a month.
- Industrials: New to the top 3. This is a tactical rebound call, not a strategic upgrade (yet). The sector fell 2.8% since the last update and ranks 5th on the composite. But Mark sees it bottoming. Two weeks ago, he wrote that Industrials might bounce quickest of the beaten-down groups. Equal-weight Industrials (RSPN) had cleared its downtrend from mid-August, with an initial target of 61.50 (roughly 177 on XLI). By September 25, MACD had made a bullish crossover and RSPN had stabilized at its May lows. Then last Friday, the Dow Transports rebounded sharply from 19,330. That level lined up four supports. These were the 50% retracement of the rally from the 2025 lows, an 18-month trendline, Ichimoku cloud support, and a confirmed TD Buy Setup. Most recently, Mark called it a great area to buy dips, though momentum still needs to turn. The composite agrees at the margin, with Trend Score improving from 8th to 5th. Strategically, Mark stays Neutral because the relative trendline from 2022 broke in May. Tom remains Overweight.
Bottom 3 Tactical Underweight
- Communication Services: A 4th consecutive month in the bottom 3. The sector has been a tactical underweight since the July report, when Mark also cut his strategic rating to Underweight. It did rise 3.9% since the last update and beat the S&P 500 by 3.2%. But the gains were narrow. META broke out to an eight-month high in September, while only 21.7% of sector members are above their 20-day moving average. The composite still ranks the sector 7th. Until the sector shows sustained relative strength on an equal-weight basis, the underweight stays.
- Utilities: New to the bottom 3. This is the tactical expression of the strategic downgrade above. Mark noted on September 21 that Utilities and Staples looked set to underperform for roughly three weeks. Only 3.2% of members are above their 200-day moving average, the weakest reading in our coverage.
- Consumer Staples: Still in the bottom 3, and still the weakest defensive group. The sector fell 2.5% since the last update. It ranks last on DQM and 10th on EPS Score. As noted above, between the two consumer sectors, Mark does favor Discretionary over Staples. And he noted the sector needs to bottom before food stocks are worth considering. The double strategic Underweight from Tom and Mark keeps this our largest underweight at -3.5% versus the index.
Besides the top 3 and bottom 3, two sectors are worth mentioning:
1\ Energy exits the top 3 even though it ties Technology for the highest composite score. Its Trend Score and DQM both rank 2nd. The strategic downgrade explains the change. Mark expects the relative ratio to pull back further before it turns up. Energy returns to market weight.
2\ Real Estate exits the bottom 3 even though it ties Staples for the lowest composite score. The sector fell 6.9% since the last update, and only 3.3% of members are above their 20-day moving average. Mark has grouped Real Estate with Utilities as sectors to avoid while yields rise. This month the Utilities breakdown looks cleaner on the relative chart. Real Estate returns to market weight.
Portfolio Weight Changes vs Last Month
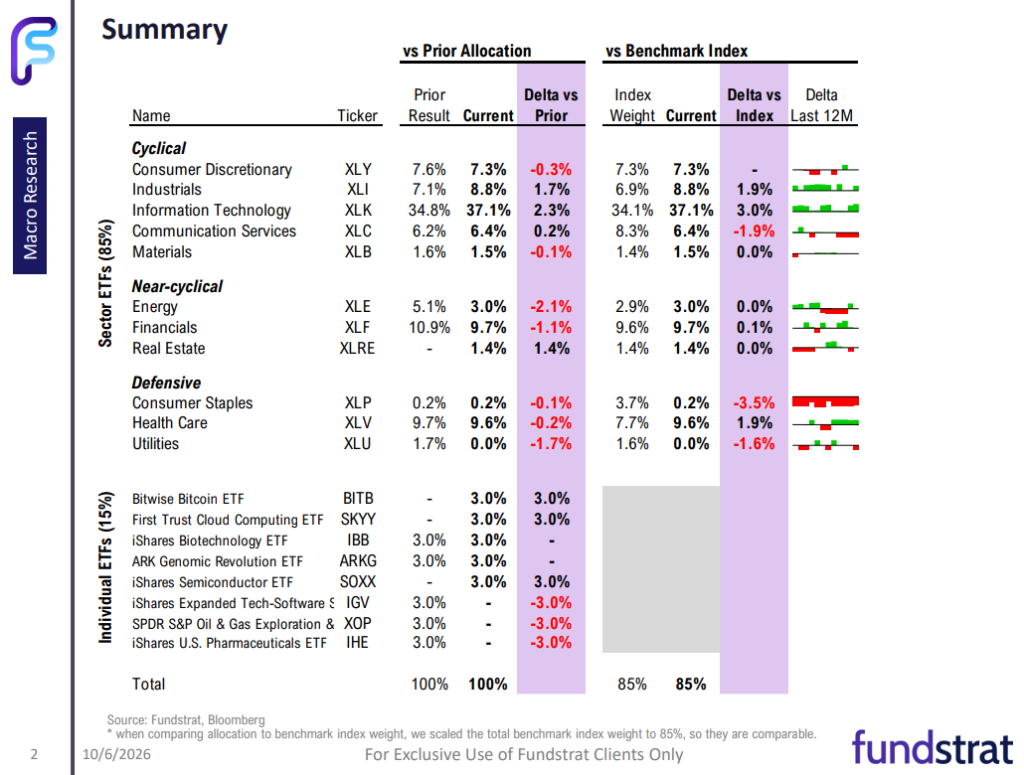
The main driver this month is the double Overweight pool. Last month it was shared among Technology, Energy, and Financials. Now Technology is the only recipient.
Increases
- Information Technology +2.3% to 37.1%. Technology picks up the full double Overweight allocation plus the +1.9% tactical overweight. It is +3.0% versus the index, our largest overweight.
- Industrials +1.7% to 8.8%. This comes from entry into the tactical top 3. The overweight versus the index grows from +0.1% to +1.9%.
- Real Estate +1.4% to 1.4%. Leaving the bottom 3 returns the sector to market weight.
Decreases
- Energy -2.1% to 3.0%. Energy loses both its tactical overweight and its double Overweight uplift. It goes from +2.1% versus the index to market weight.
- Utilities -1.7% to 0.0%. The tactical underweight takes the sector to zero.
- Financials -1.1% to 9.7%. The downgrade removes the double Overweight uplift. The sector is now close to market weight at +0.1% versus the index.
Consumer Discretionary, Communication Services, Health Care, Basic Materials, and Consumer Staples are largely unchanged. Mark’s Discretionary downgrade does not move the weight because Tom remains Neutral.
ETF Performance Recap and 5 ETF Picks for October
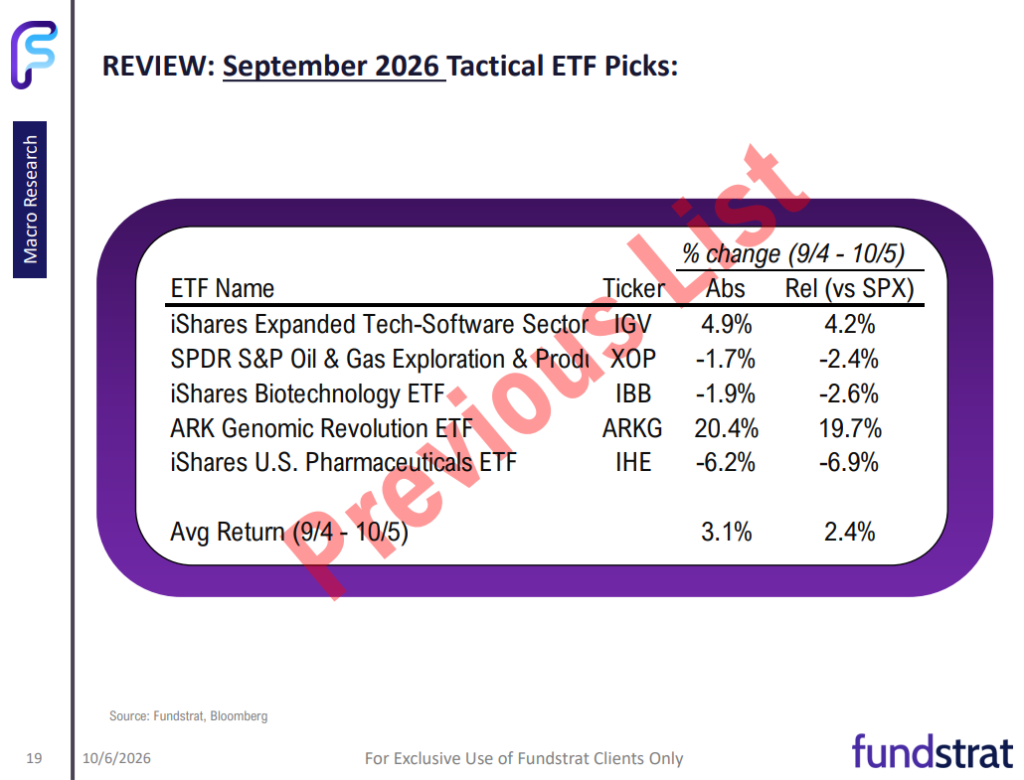
September’s basket returned +3.1% on average from the September report (9/4) through 10/5. That beat the S&P 500 by 2.4%. Only 2 of 5 outperformed, and one name did most of the work.
- Best performing: ARK Genomic Revolution ETF (ARKG) led at +20.4% (+19.7% relative). iShares Expanded Tech-Software Sector ETF (IGV) gained 4.9% (+4.2% relative).
- Laggards: Despite ARKG’s strong performance, the other two Health Care ETFs lagged as the sector came under pressure last month. iShares U.S. Pharmaceuticals ETF (IHE) fell 6.2%, the worst in the basket. iShares Biotechnology ETF (IBB) slipped 1.9%. SPDR S&P Oil & Gas Exploration & Production ETF (XOP) also fell 1.7% as overall situation in Middle East de-escalated and crude oil price declined.
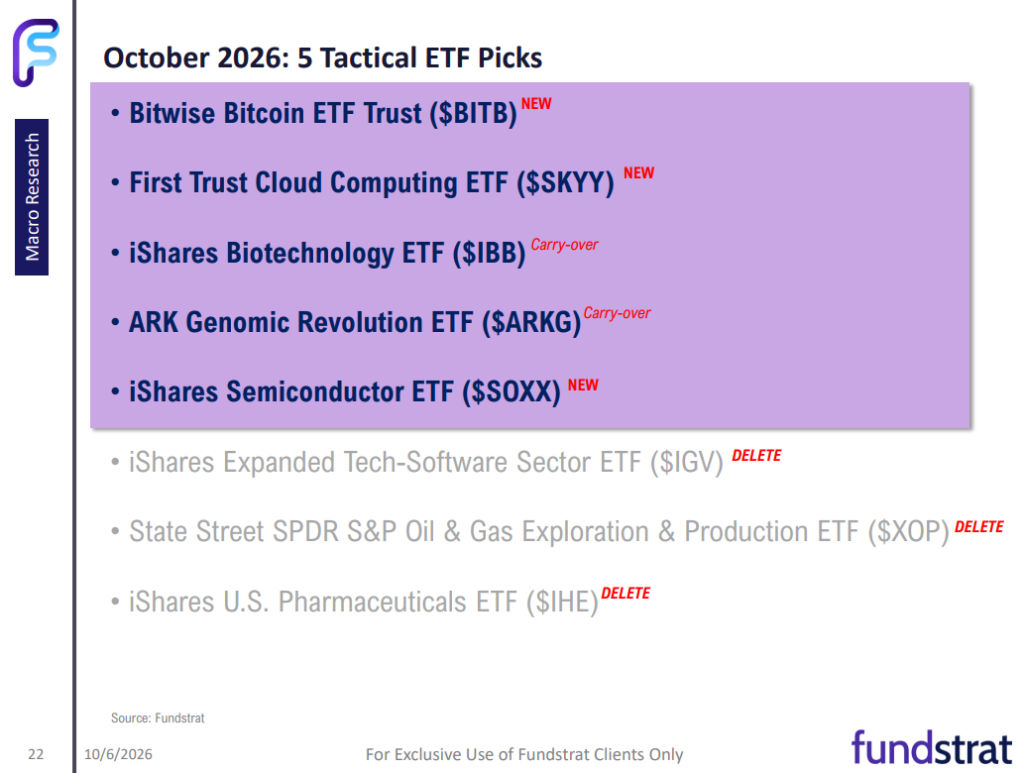
For October, Mark keeps IBB and ARKG and makes three changes. IGV, XOP, and IHE come out. Bitwise Bitcoin ETF (BITB), First Trust Cloud Computing ETF (SKYY), and iShares Semiconductor ETF (SOXX) go in. XOP’s exit follows the Energy downgrade and IHE is (relatively) weaker than IBB.
- iShares Semiconductor ETF (SOXX) (NEW, replacing IGV): SOXX is the semiconductor expression of the Tech overweight. In early September, the Semis to Software ratio (SMH/IGV) broke its downtrend from late June. Mark said then that he supported overweighting semis over software for the next month. Semiconductor indices broke out on September 21. And most recently, Mark called semis a work in progress after their deep drawdown. He expects a few more pushes higher, then a consolidation that builds a larger cup-and-handle base. He does not expect new all-time highs before late October. A move to 655 on SOXX would mark that breakout, which is more than 10% above current levels.
- First Trust Cloud Computing ETF (SKYY) (NEW): SKYY keeps software exposure in a broader form. It is equal-weighted and capped at 4.5% per name. Holdings span infrastructure names like ANET and DigitalOcean along with Microsoft, Oracle, and Alphabet. That fits Mark’s point that the Technology breakout is broad-based rather than concentrated.
- Bitwise Bitcoin ETF (BITB) (NEW): Mark’s view on crypto has turned. He believes crypto has bottomed for the year and the bear market is over. His weekly cycle for Bitcoin points higher into 2028. He expects Bitcoin to reach about $92,000 to $93,000 first. After that, he sees a pullback to the low $80,000s. His short-term cycle looks to have turned down in late September, though prices have not turned down yet. He expects some downward pressure into the midterms. He named November 5 to 15 as the window to buy dips for those timing it closely. For longer-term holders, he is comfortable owning it here and adding on weakness.
IBB and ARKG carry over. Mark did flag a near-term risk in IBB. After the run from 163 to 215 since June, IBB has made a minor technical break. It could pull back about 5% to near 195. He views this as consolidation within the uptrend.
Current Five ETF Picks
- Bitwise Bitcoin ETF (BITB): NEW
- First Trust Cloud Computing ETF (SKYY): NEW
- iShares Semiconductor ETF (SOXX): NEW
- iShares Biotechnology ETF (IBB): Carry-over
- ARK Genomic Revolution ETF (ARKG): Carry-over