




Near-term US Equity trends are positive but overbought following SPX, IWM, and QQQ’s recent push to new high territory, while Equal-weighted SPX and DJIA have lagged. Despite price being seemingly stretched and leadership growing a bit narrow, there remains no evidence of any technical weakness that would signal the beginning of any consolidation. While the outperformance in large-cap Technology and specifically, Semiconductor and Magnificent 7 stocks lately has masked some weaker spots within SPX, Technology has been fully able to absorb weakness in other sectors without leading stock indices lower. Similar to last week’s thinking, it’s right to be long Financials, Technology, and Industrials as the sector “overweights” while expecting the Defensive sectors might lag performance. Bottom line, I expect the recent sharp move will likely require consolidation in May. However, at present, it’s prudent to watch for evidence of trend deterioration before attempting to sell into this rally. Wednesday’s close failed to show much evidence of any pullback getting underway. Thus, until this happens, it’s right to lean bullish.
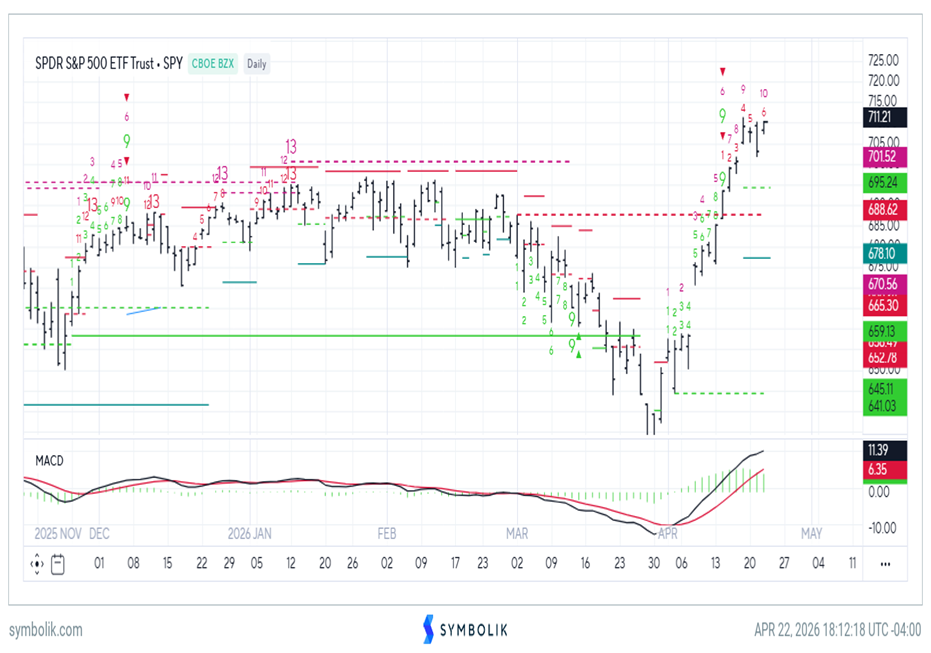
As shown below, the push in SPY still looks to have a possible 2-3 trading days left in the short run before exhaustion signals likely could begin to materialize. Given AAPL’s breakout of its minor downtrend this week, the combination of the breakout in this high percentage index name, along with the lack of DeMark exhaustion, still suggests that US Equity markets might hold up a bit longer before beginning a possible period of consolidation.
Given that four mega-cap Tech companies report earnings between 4/29’s close to 4/30 (which could represent the heaviest day for S&P 500 earnings by index weight in the last decade), this day might set up as a pivotal test for this bounce. AAPL, META, GOOGL, AMZN, and MSFT earnings are all expected during this time.
Outside of Equities, WTI Crude’s minor bounce in recent days has failed to shake the positive mood for risk assets, and given that the pattern suggests further gains should prove muted before the start of a selloff, such a move is thought to be positive for risk assets.
At present, as the daily SPY chart shows below, the DeMark-based exhaustion count based on TD Combo, which was present at the January 2026 peak, looks to be at least three trading days away. Follow-through up to 7200 might allow for this to materialize early next week, which, for now, looks premature. QQQ has a similar count, which looks to be one day closer to exhaustion and shows an “11 count (out of a possible 13) on its daily chart.
SPDR S&P 500 ETF Trust – SPY
Semiconductor stocks need to be watched carefully after this run-up
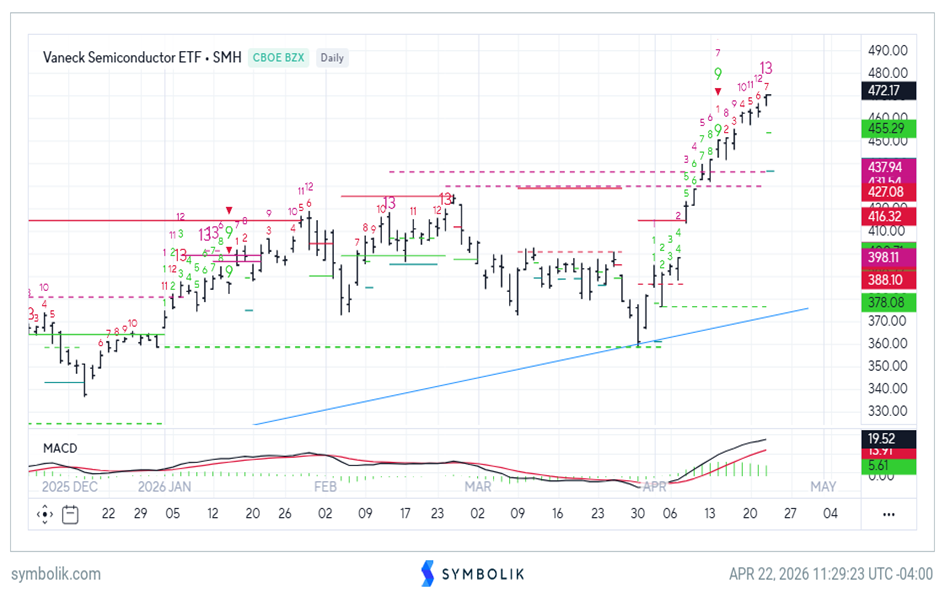
Semiconductor stocks will be a group within Technology to keep a close eye on, given the extent of the rise over the last three weeks. In 16 days, the VanEck Semiconductor ETF (SMH) has climbed 31%, or nearly 2% a day, and daily, weekly, and monthly RSI are all above 70, firmly in overbought territory.
As we know, “overbought” does not mean “Sell,” but SMH has finally produced its first daily sign of exhaustion based on DeMark indicators with a TD Combo Sell signal that appeared today.
While this requires a confirmation (in the form of a close under the close of four days prior), it’s noteworthy that this has gotten so stretched and is now showing its first evidence of exhaustion. Note, these are not yet present on intra-day timeframes like 60-minute or 120-minute charts, so I fully expect this to likely push up into the end of the week (or early next week). However, the risk/reward profile has grown subpar for those with a short-term timeframe.
My thinking is that 480-490 is a possibility, but I am not expecting much further upside before this starts to turn back down. As always, it’s worth watching for evidence of actual trend deterioration before expecting much weakness, and this initially requires a close under $452. Overall, the SMH trend is highly bullish, but just overdone and not the best near-term risk/reward until consolidation can occur.
Vaneck Semiconductor ETF – SMH
Apple breakout likely helps SPX, QQQ stay afloat a bit longer
One of the most important stocks to focus on within the US Equity indices outside of NVDA is AAPL, which still represents the 2nd largest stock by market capitalization within ^SPX and QQQ.
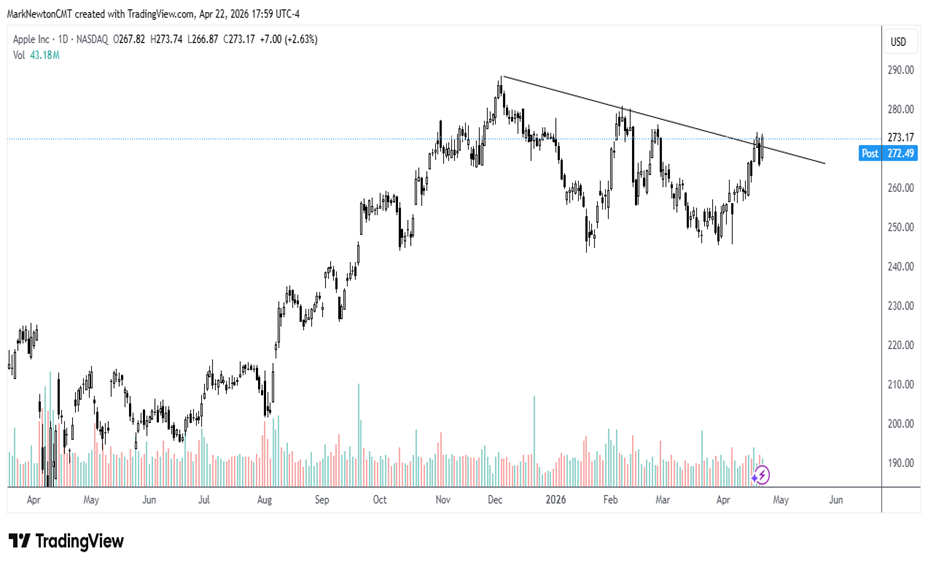
As shown below, AAPL has just exceeded the entire triangle resistance that had been intact since last December. While the stock did briefly pause near this same level on Monday, today’s progress is helpful towards expecting some upside follow-through in the days ahead.
My expectation is that AAPL likely pushes up to $281 initially and then, following a minor consolidation, rallies up to challenge and exceed all-time highs.
Given its heavy weighting in US indices, it’s important to see that stocks like AAPL are just starting to participate and push higher, which should help the indices in the days to come.
Apple Inc
Aerospace & Defense has begun to grow a lot weaker, technically
Many of the popular Aerospace and Defense stocks have shown real deterioration in the wake of the ceasefire announcements lately. While the iShares US Aerospace & Defense ETF (ITA) rose over 64% in the prior 12 months, its recent trajectory has proven subpar despite no credible evidence of an Iran deal having been reached.
As we know, the market tends to be forward-looking, so any hint of a peace deal in the works, which might shift future spending priorities, might result in weakness for many of the Aerospace and Defense names.
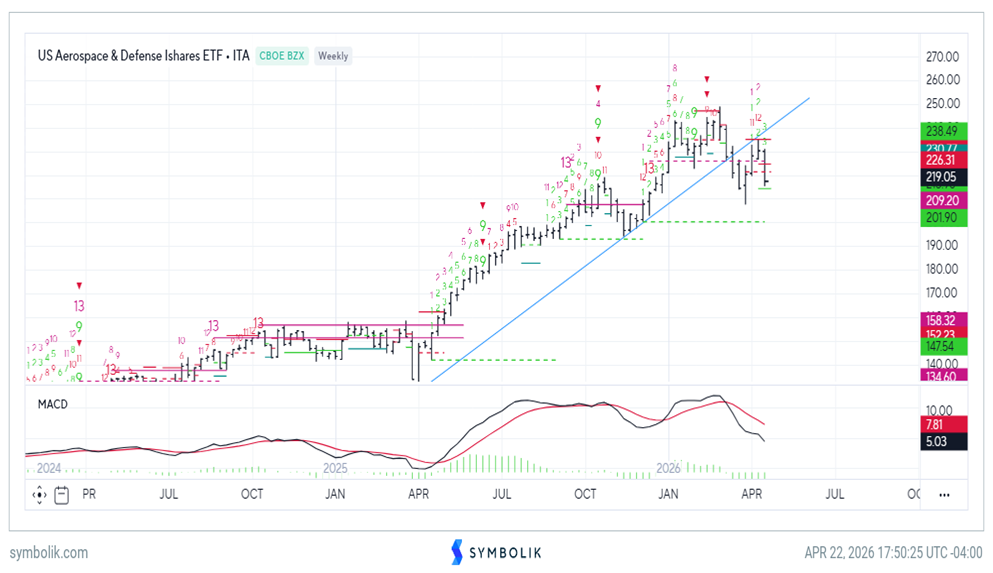
ITA broke its one-year uptrend two months ago, and now the recent bounce attempt also looks to have failed to regain its uptrend. Popular momentum indicators like MACD have made bearish crossovers of the signal line in the past two months, which might warn of possible additional technical difficulty.
Stocks like KTOS, AXON, NOC, LMT, and HII have all fallen more than 10% in the last month, and ITA’s weekly chart has reflected this weakness by gradually rolling over.
Overall, those who are positive on the space will need to see ITA hold its late March lows at $209.31, which, if breached, would likely result in a retest of last November’s lows near $196.
To be bullish on this sub-sector, ITA requires a weekly close back over $236.66, technically speaking. Until this occurs, it’s wise to hold off on adding to stocks that have fallen in recent weeks.
US Aerospace & Defense iShares ETF – ITA
______________________________
PS: If you are enjoying our service and its evidence-based approach, please leave us a positive 5-star review on Google reviews —> Click here.