


Near-term US Equity trends remain bullish, and the constructive framework from last week’s interim-deal reaction is still intact even as today’s FOMC meeting under new Chair Warsh brings a bout of chop. The notable cross-currents are a bounce in the US Dollar back up to test multi-month resistance and a sharp pop in the front-end, with the 2-year yield spiking to two-week highs, an apparent hawkish tilt on Warsh’s first meeting as Fed Chair. I’d be careful reading too much into it. Warsh submitted no dot and looks set to scrap forward guidance, and with a Strait-reopening deal possibly signed Friday, the ceasefire trade carries more near-term weight than FOMC-day volatility. None of it breaks anything; ^SPX has just backed and filled from Monday’s highs into Fibonacci support, the kind of minor consolidation I flagged rather than the start of a larger setback, which still looks postponed until late summer. A reopening Strait should pull Crude, inflation, long rates, and the Dollar lower, so I suspect Wednesday’s move in DXY and the 2-year at resistance proves an exaggeration, even as the equity momentum trade stays resilient and Biotech breaks out to multi-year highs. It’s technically right to lean bullish and use this pullback to add exposure, with the June lows the level I’m skeptical gets violated right away.
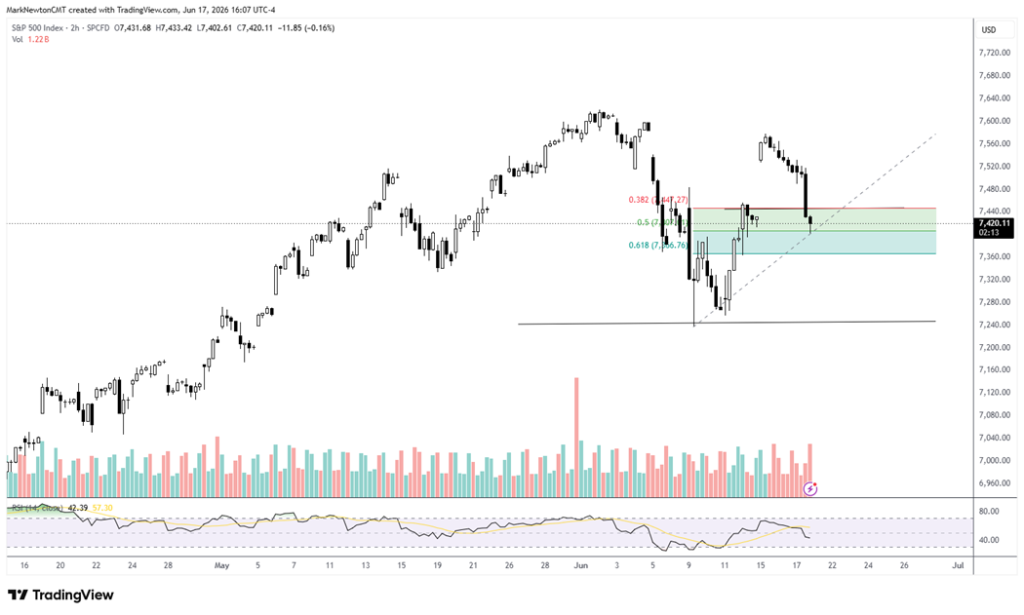
^SPX is backing and filling into Fibonacci support after today’s FOMC, and the pullback looks buyable
^SPX has pulled back from Monday’s high near 7,560 to trade around 7,420 by Wednesday’s close, settling right into the 0.5 to 0.618 Fibonacci retracement support of the early-June rally between 7,447 and 7,356. This appears like “backing and filling” in the wake of today’s FOMC, not a trend break, with price holding well above the early-June low near 7,240. I flagged the gap-fill and minor consolidation on Monday, and this is simply it playing out, so I’d use the weakness to add rather than fade. It would take a daily close beneath 7,396 to raise any near-term concern, and I’m skeptical the June lows get tested right away.
S&P 500 Index (^SPX, 2-hour) – Backing and filling into the 0.5 to 0.618 Fibonacci support of the early-June rally in the wake of today’s FOMC
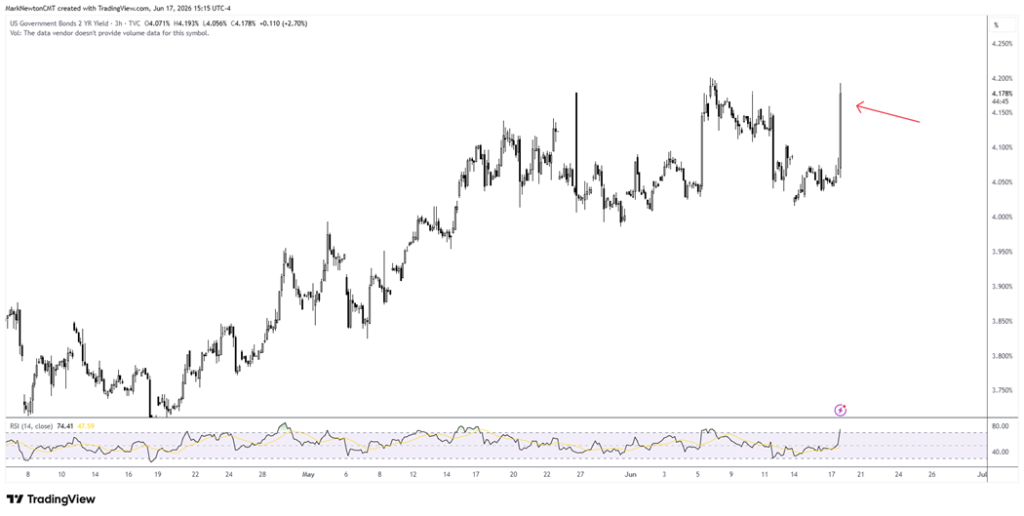
The 2-year yield spiked as Warsh spoke, but I’d be careful extrapolating a hawkish tilt as the new normal
The 2-year Treasury yield jumped Wednesday to the highest in about two weeks near 4.18%, a sharp move as Warsh spoke at today’s meeting that, taken with the Dollar’s bounce, reads as an apparent hawkish tilt.
The 10s-2s curve has largely been flattening out since the beginning of the year, and today’s -21.81 bp flattening reached levels not seen in over a year.
Technically, this move in 2-year yields doesn’t look too significant as a “game changer” but has simply brought yields back up to the highs of the recent range. While the market will need time to get acquainted with how Warsh reshapes policy, this argues against extrapolating one volatile FOMC-day move into a new hiking regime. With a Strait-reopening deal possibly signed Friday, the ceasefire trade carries more near-term weight than this FOMC noise, and a reopening should bring Crude, inflation, and long rates back down. I suspect Wednesday’s spike at resistance proves an exaggeration.
US 2-Year Treasury Yield (intraday) – Spike to two-week highs near 4.18% as Warsh spoke looks exaggerated against the ceasefire trade
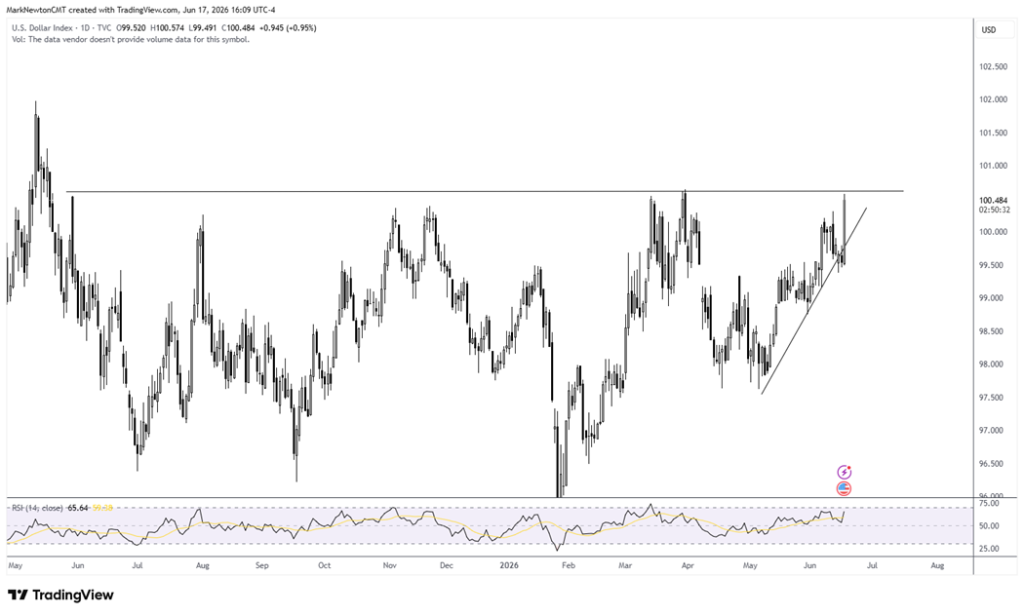
The US Dollar has bounced to test multi-month resistance, but the move looks like an exaggeration
Similar to the 2-year yield, the US Dollar index (DXY) rallied +0.95% Wednesday to close near 100.48, pushing up off the May lows to test the horizontal resistance near 100.50 to 101.00 that has capped rallies in the US Dollar going back to last summer, along with the March and April peaks.
Like the 2-year, this US Dollar bounce came as Warsh spoke at today’s meeting and looks more like an exaggeration than a genuine trend change. While USD/JPY did make a minor breakout to the highest level in more than one year, I expect DXY to fail at this resistance and resume the decline that started in April. A daily close back above 101.00 would defer that, but the weight of evidence still points lower.
US Dollar Index (DXY, daily) – Counter-trend bounce testing the 100.50 to 101.00 resistance from the March and April peaks
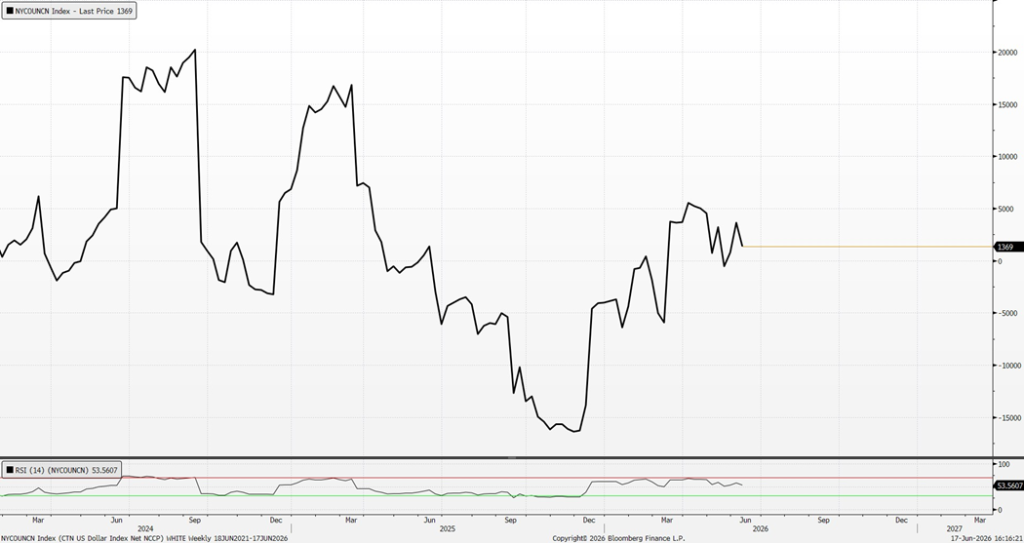
Dollar positioning is only neutral, which leaves room for the larger decline to extend
Net speculative (Non-Commercial) CFTC positioning in the US Dollar remains at levels not seen since early last year, as most seem to be favoring US Dollar strength.
While levels were higher in 2024, the fact that this has steadily risen over the last six months makes it difficult to accept Wednesday’s spike in the US Dollar as being the start of a “new” trend.
I read this as supportive of the weaker-Dollar thesis over the next few months, which could occur as the Hormuz Strait is fully reopened, not a contrarian warning against it.
US Dollar Net Speculative Positioning (CFTC, weekly) — Has steadily risen over the last six months, which might prove to be the wrong move on a completed Iran deal
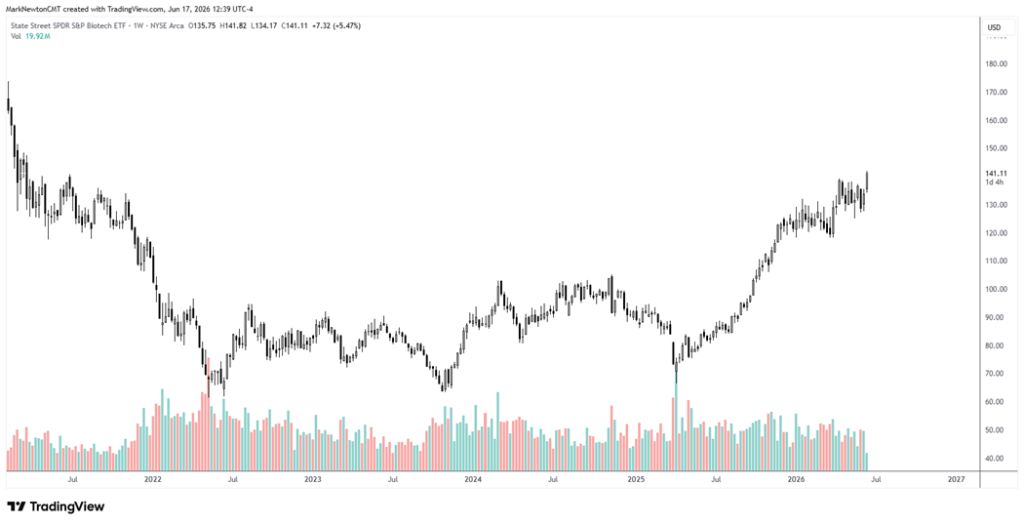
Biotech (XBI) breaks out to multi-year highs, given the surge over the April 2026 peak
XBI has pushed up over +5% week-to-date to trade near 141.11, breaking out to its highest levels since early 2022 and clearing the entire 2022–2025 base. Despite XBI being quite choppy since late 2025, the push over April 2026 highs does represent a genuine multi-year breakout and suggests that Biotechnology might be able to show some strength during this seasonally bullish time for Healthcare.
Interestingly enough, however, it hasn’t been stocks like BIIB, AMGN, REGN, and GILD doing the heavy lifting, but rather some of the smaller names.
The top 10 stocks by percentage within the State Street SPDR S&P Biotech ETF (XBI) — which represent just 16.9% of the ETF — all look good technically at current levels.
These are as follows: TVTX, TGTX, TWST, RVMD, ALKS, ARWR, KRYS, EXEL, NUVL, and NBIX.
Others like INCY, PTCT, and MRNA have also kicked into gear and are trading much better.
Thus, Biotechnology (based on XBI, but not yet IBB) looks to be joining the push to new multi-year highs, which was recently achieved by the HMOs as seen by XHS.
Thus, while the late-day Wednesday decline did result in some intraday weakness for XBI, it still achieved the breakout as of the close and looks appealing to follow through higher.
My technical targets lie at $157, then $173 for XBI. Other ETFs like iShares Biotechnology ETF (IBB) require a move above $179.48 to join suit in this rally.
SPDR S&P Biotech ETF (XBI, weekly) – Breakout to the highest levels since early 2022, clearing the multi-year base
______________________________
PS: If you are enjoying our service and its evidence-based approach, please leave us a positive 5-star review on Google reviews —> Click here.