



Note: As part of our transition from FS Insight to Fundstrat Direct, my daily notes will transition from mark.newton@fsinsight.com to mark.newton@fundstratdirect.com. Please add the new address to your contacts or safe sender list to ensure uninterrupted delivery. The research and insights you rely on will remain exactly the same — only our name and sender address are changing. If you have questions, please visit our FAQ here.

US Equity trends remain choppy and volatile but directionally sideways, despite Monday’s initial breakdown attempt. While the breakdown in DJIA proved bearish, there wasn’t a coinciding breakdown in SPX nor QQQ, and these both managed to hold up in better fashion. Given the exhaustion counts present in sectors like Technology, along with relative ratio charts in Consumer Discretionary vs. Consumer Staples nearing support, I suspect that any further weakness this week likely proves short-lived and shouldn’t last more than another week before the start of a push back higher. However, it’s important to relay that today’s bounce didn’t look too meaningful after the early weakness, and I still suspect that weakness could happen this week before prices reach support and turn higher. Furthermore, the turn higher in Crude oil and US Treasury yields both look important in the short run, and it’s expected that some additional strength in Energy is likely into mid-month. In the bigger scheme of things, there looks to be a possible window for weakness this week, which shouldn’t last longer than 3-5 trading days and result in a chance to buy dips for an eventual rally this month.
Monday’s gap down for US Equity indices failed to extend too dramatically initially, but it remains difficult to get too bullish given the sharp breakout in WTI Crude and the US Dollar while US Treasury yields began to push higher.
Most of the intra-day charts maintain a negative bias after the early morning breakdown, and despite the ability to claw back during Monday’s session, they didn’t recuperate sufficiently to negate the bearish effects of the early day breakdown.
Thus, while I am not expecting a multi-week decline at this point, I feel that more short-term weakness is very possible today given the pick-up in cross-asset volatility.
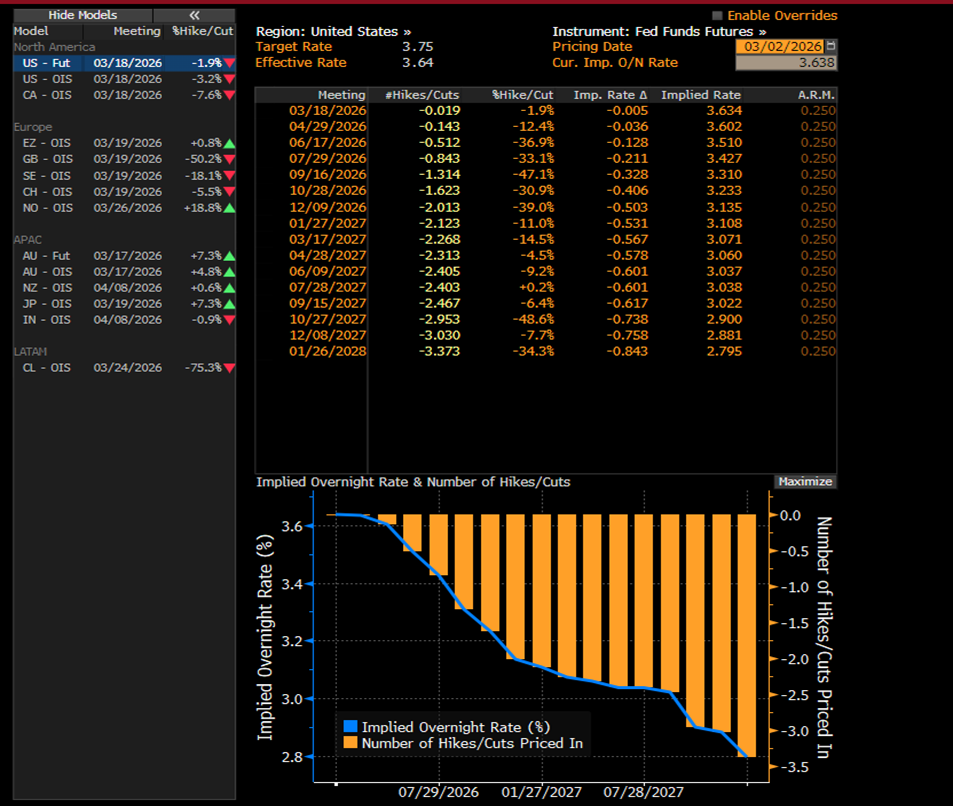
As seen below, this trend was initially violated on intra-day charts of S&P 500 and QQQ and wasn’t recouped despite the intra-day rally back to near unchanged levels by the close.
While the broader support levels held on Monday, it’s hard to argue thus far that lows are in place, given the cross-asset volatility and lack of structural improvement in short-term charts.
Bottom line, 6796 needs to hold for any short-term bullish case, and ideally, ^SPX would push back over 6952.51. I’m doubtful this happens right away, but this is the level to watch.
On the downside, breaks of 6796 would allow for a challenge and break (in all likelihood) of December 2025 lows at 6720. If December lows are broken, then a swift pullback to challenge last November’s lows near 6521 cannot be ruled out. For now, this is hard to call for until/unless 6796 is broken, but it cannot be ruled out this week.
S&P 500 Index
WTI Crude could reach last year’s peaks before any resistance
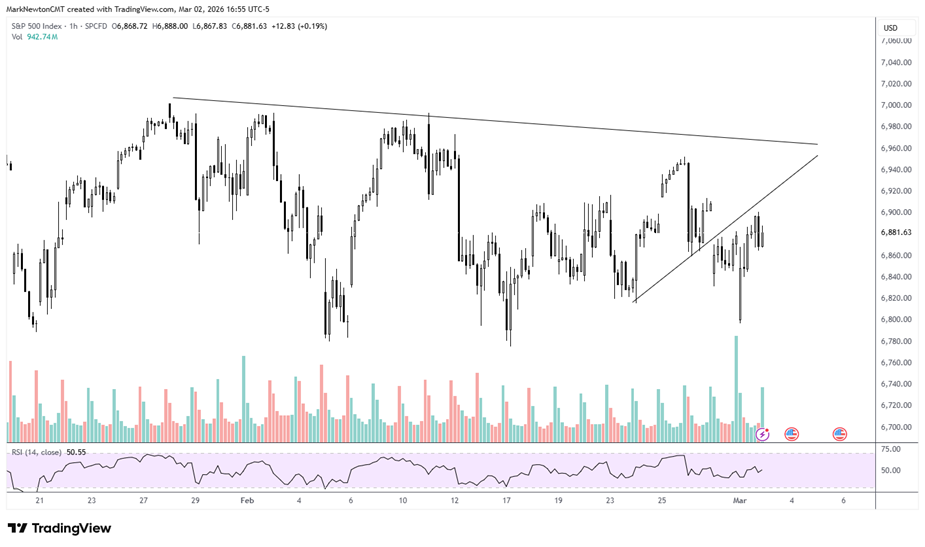
This weekend’s Iran attack resulted in WTI Crude oil spiking more than 6% by Monday’s close, and Crude looks set to push even higher this week before any resistance to this rally occurs.
Technically, this open gap surge from Monday likely results in peaks from last year being tested and should help Energy outperform into mid-month before a much-needed consolidation gets underway.
While I don’t expect that this leads to $100 in Crude, it looks early to expect an immediate selloff, and today’s move looked to be a continuation breakout from what happened last week.
While the Strait of Hormuz might not be shut down, there have been reports of Lloyd’s of London pulling back from insuring ships traveling through the Strait, and I suspect that Crude and Energy should rally most of this week before finding resistance.
June 2023 peaks lie near $78.40 and above, and early 2025 peaks lie at $80.77, and both of these very well might come into play. At present, it’s right to be bullish and overweight Energy, technically speaking, as this rally looks to extend this week.
Light Crude Oil Futures
Treasury yields look to have made a strong reversal; Higher yields are likely in the month to come
While some felt that an early Stock market selloff coinciding with WTI Crude oil pushing higher might have led to a flight to safety type move for Treasuries, yields did the opposite.
Yields suffered a “1-2 punch” today, given the combination of surging prices from the ISM Manufacturing survey, along with the rapid spike in WTI Crude oil.
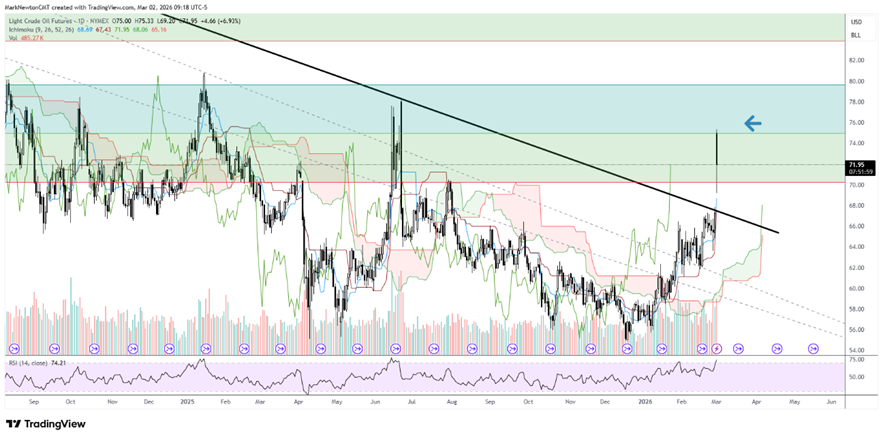
^TNX (US Government Bond Treasury Note index) pushed up nearly 9 basis points (b.p.) on the day, exceeding the downtrend from early February in the process. Technically, my recent notes discussed a good likelihood of a technical reversal in trend, and I feel this likely happened today.
Note, historically geopolitical shocks that lead to oil disruption have resulted in yields going higher, not lower, and this was the case during the first Gulf War in 1990, along with the oil shock that happened when Russia invaded Ukraine in 2022.
My technical thesis calls for rates to begin to trend back higher to test and break above early January 2026 highs in yields near 4.31% en route to 4.50-4.55%
US Government Bonds 10 YR Yield
Fed rate cut chances continue to fall, given Crude rally
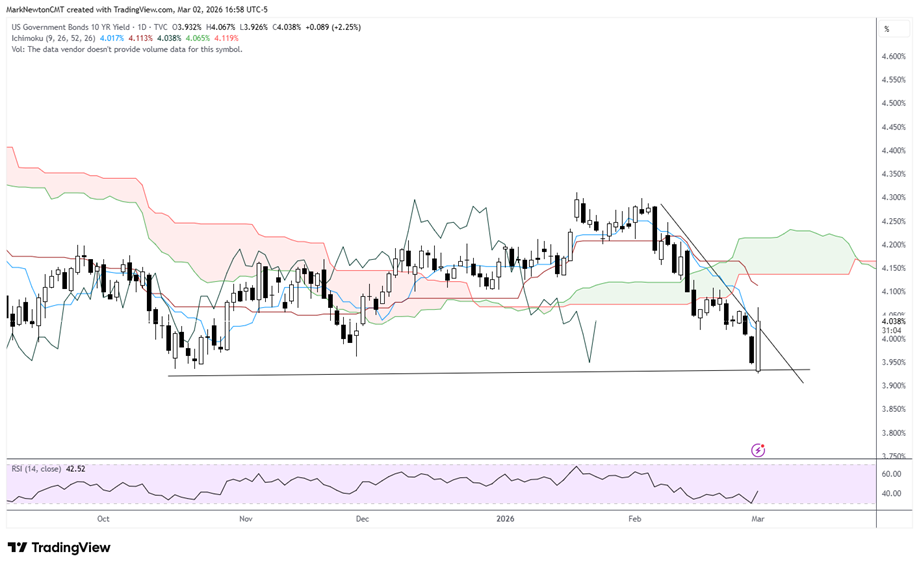
This weekend’s Iran attack has caused the Swaps market to reduce the likelihood of a Summer 2026 rate cut and shows that the first full cut might not happen until September instead of July.
Furthermore, the entire year now shows just two rate cuts, and both of these are being priced in during 2H 2026.
Overall, the combination of rising inflation risks from an oil price surge, coupled with the ISM Manufacturing survey prices rising, could make for a contentious transition in the FOMC Chair role in the months ahead.
For now, the data had already started to give reasons for FOMC members to be a bit more hawkish. Now, sharply rising Crude prices likely could add to this thesis.
While I don’t expect Crude prices to remain trending up through the spring, it’s necessary to see some evidence of trend reversal before adopting much of a bearish tone.
With regards to rate cuts, the table below shows the Swaps market having reduced the chances for a cut before September.
Swaps Market