



Note: As part of our transition from FS Insight to Fundstrat Direct, my daily notes will transition from mark.newton@fsinsight.com to mark.newton@fundstratdirect.com. Please add the new address to your contacts or safe sender list to ensure uninterrupted delivery. The research and insights you rely on will remain exactly the same — only our name and sender address are changing. If you have questions, please visit our FAQ here.

Near-term SPX trends remain bearish, and trends and momentum remain negatively sloped while market breadth is in dire need of immediate recovery. For now, the risk-on trade remains captive to WTI Crude oil and progress in reopening the Hormuz Strait. In the short run, Wednesday’s breakout in WTI Crude back higher likely can result in a push back to $115, and the breakout in global bond yields might prove more troublesome to Equities in the short run. Until evidence of capitulation arises, it’s likely that US Equity indices are setting up for a coming test of last November 2025 lows. It’s thought that U.S. equities require a lot of strength and breadth improvement to expect that a further selloff into April can be avoided, and for now, volume hasn’t been strong enough into Declining issues to think that any evidence of capitulation is at hand. Most investors arguably should continue to favor a heavily diversified stance and overweight defensive sectors like Utilities, Telecom, and Pharmaceutical stocks until Technology can show more evidence of stabilization.
U.S. equity trends turned back down sharply, coinciding with the breakout in WTI Crude oil early on Wednesday, and evidence that Qatar has expelled Iranian diplomats is resulting in a price spike back up to near $100 following the cash close on Wednesday.
Simply put, this is a short-term negative for risk assets, as it’s also directly coinciding with an attempted breakout across the globe in sovereign bond yields. Wednesday’s trading brought about a decline in every major sector, and volume has not shown the kind of severe overbalance into declining issues to deliver an Arms index (TRIN) reading that might spell capitulation.
It should be interesting to see how much this coming Quarterly options expiration might affect the level of dealer “gamma,” which has been keeping a lid on prices in recent weeks, as this disappears following the March options expiration this Friday.
For now, it’s right to be defensive, as trends are bearish and until there is evidence of Crude backing down along with US Treasury yields,
To reiterate yesterday’s key levels, support for ^SPX and QQQ lies at ^SPX-6623.92 and QQQ-591, respectively. Movement down under these levels would likely cause downward acceleration to test last November’s lows.
On the upside, if/when price does manage to get above ^SPX-6845 and/or QQQ-617, this would change the technical picture for both ^SPX and QQQ to more constructive. At present, the benefit of the doubt still has to be given to “the Bears”.
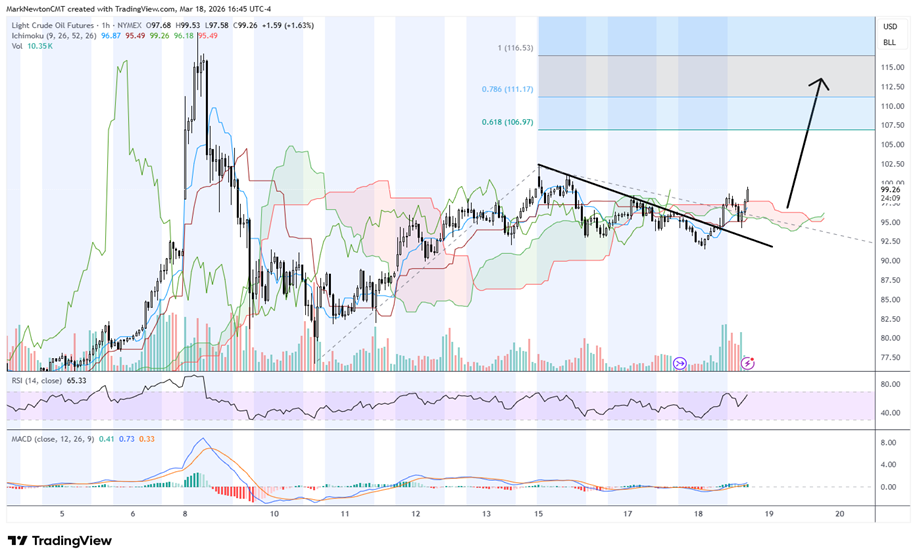
Below is the chart that has a meaningful impact on US equities, given the most recent negative correlation, and that is WTI Crude oil.
Price achieved a minor one-week breakout earlier today, which immediately coincided with Equities weakening, so this relationship of Crude’s price moving opposite to Equities likely continues a bit longer. Given that Crude goes to $110-$115 and tests former highs, it likely would result in Equities weakening if this relationship continues to hold.
Light Crude Oil Futures
Bund yields are on the verge of a major multi-year upside breakout
The technical development that’s arguably equally as important for the Equity market as Crude’s direction concerns the bond market and the rapid push up in Yields lately.
What many investors are not widely talking about concerns global sovereign bond yields on the verge of important breakouts from recent ranges.
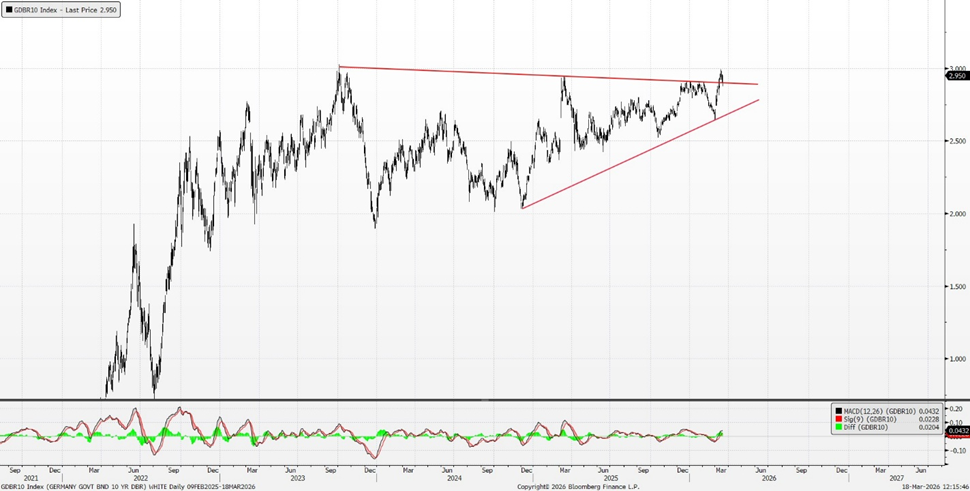
As shown below, German Bund yields, which have been relatively stronger than Treasury yields lately (meaning yields are closer to new monthly highs), are on the verge of exceeding consolidation patterns going back three years.
This technical pattern looks quite bullish, and weekly closes back above 3.00% in Bund yields likely can lead up quickly to 3.50% or even 4.00%, before they begin to settle.
While Equities have responded negatively to the recent backup in yields as Crude has pushed higher, it could possibly lead to more volatility if/when a large breakout of a big trading range happens, which results in yields pushing up more quickly.
Investors need to keep a close eye on 3.00% for 10-yr Bund yields as well as 4.29% for ^TNX in the days ahead. My expectation is that both could be broken technically over the course of the next week. Thus, a rapidly rising bond yield (for reasons based on Crude-driven inflation rather than growth) likely would not immediately be something the Equity market takes to be bullish. Stay tuned.
GDBR10 Index
Copper’s breakdown echoes what’s being seen in Gold and Silver, and is equally as bearish in the short run
The rapid backup in interest rates and evidence of possible escalation in the Middle East geopolitical situation have resulted in big breakdowns in both precious and many base metals at a time when many investors least expected it.
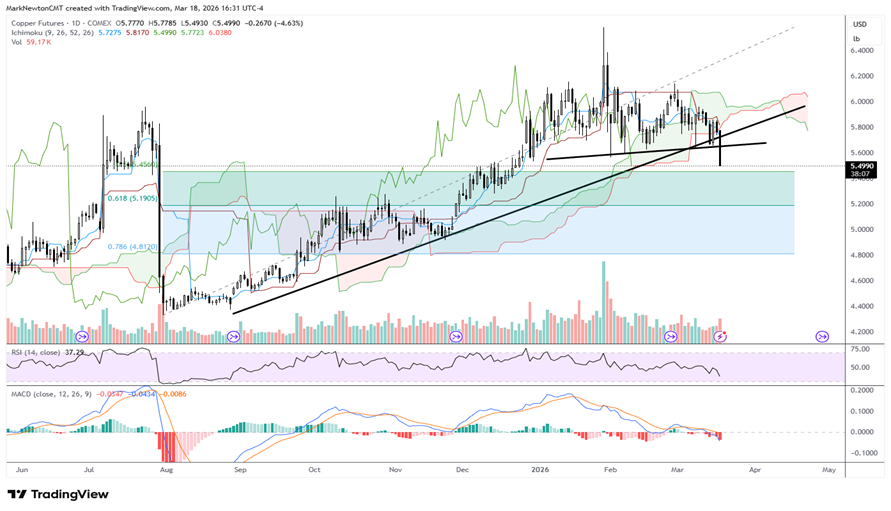
I had discussed Gold starting to weaken yesterday, and this officially broke down in a larger fashion today. However, it’s COMEX Copper which I wanted to discuss below, which has officially broken its uptrend since last Spring.
This is a topping pattern that looks to have been officially confirmed with today’s breakdown.
While there remains some mild Ichimoku-based support based on the “Lookback line” having reached the Ichimoku cloud, I give this less credibility for being as effective when the Cloud grows narrow, like it has recently.
Overall, I am expecting a possible multi-week decline in Copper, which might get down to $4.80-$4.90 (Comex Copper) before stabilizing and starting to push higher.
One should hold off on thinking today’s weakness represents an immediate buying opportunity and expect that Copper likely will be lower into mid-to-late April and potentially May.
Copper Futures
Gold’s cycle composite shows a good likelihood of prices having made a serious short-term peak, which might lead down into Summer, initially
Today’s discussion of Gold is a follow-up to last night’s discussion, so for those who missed yesterday’s report, please reference the note from 3/17/26.
When studying the short-term cycles that have had the greatest influence on Gold in recent years, we see that the combination of the 363-day and 194-day cycles both show Gold peaking out and beginning a decline.
While I was unsure as of a few weeks ago if this had begun to turn down just yet, the price action of the last week has served to confirm the downward bias of Gold.
While many investors feel that Gold should act better in a situation where inflation might be starting to pick up on higher Crude prices and/or lack of attention being paid to the deficit, I would argue that those have less relevance to how I’m inclined to view Gold in the short run.
Gold’s technical structure has begun to show some technical damage in the last month, and it’s now breaking down under its weekly “Conversion Line” with MACD about ready to cross negatively on weekly charts. Furthermore, the Elliott-wave patterns have turned much more bearish on the degree of weakness in price below prior swing lows in the last week.
My short-term cycle composite calls for possible weakness into Summer initially, followed by a bounce from July into October, which might fit with seasonal times of outperformance for Gold.
However, until/unless interest rates can begin a larger decline globally, the act of real rates rising is thought to be a negative for precious metal performance.
Gold Cycle Composite
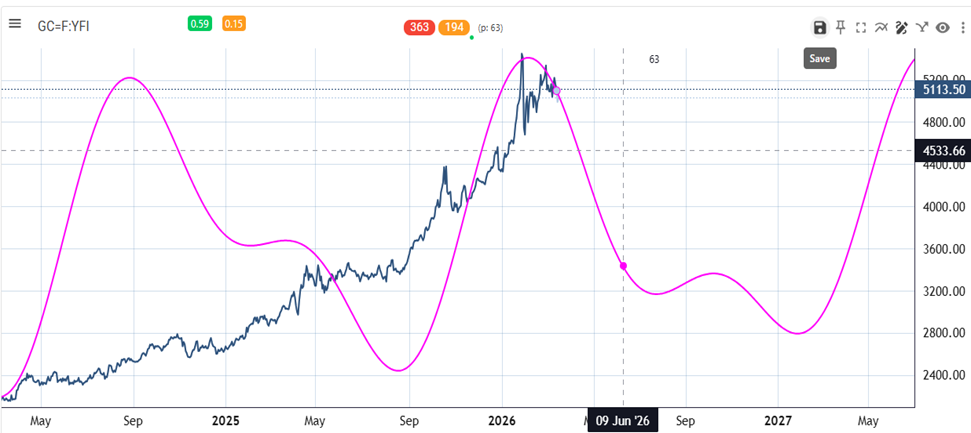
Note, this cycle composite above is not meant to show the magnitude of the move in Gold, but rather just key turning points based on amplitude. Overall, I suspect that following Gold’s monthly RSI having gotten to 95, it made sense to look for evidence of Gold starting to turn lower.
While the intermediate-term uptrend remains very much intact on weekly and monthly charts, the daily shows a clear breakdown that aligns with the cycle below at a time of long-term interest rates pressing higher. My thoughts are that Gold investors will require some patience as Gold consolidates in the months ahead.
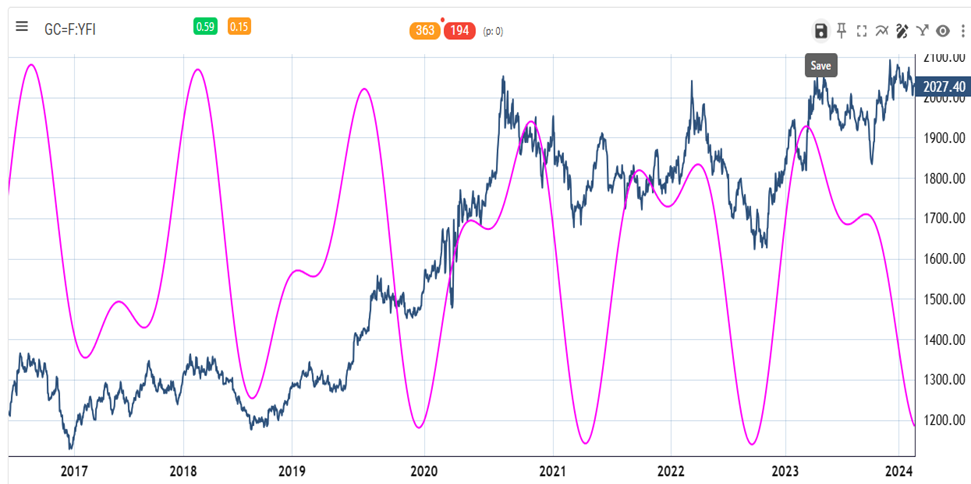
Gold’s prior years since 2018, using this same cycle composite, are shown below
While cycles can change course, the near-term prospects for Gold don’t look too bright when examining the recent cycles going back over the last decade.
As seen below, the same composite, which was shown above, is shown from 2018 to 2024 and happened to catch quite a few peaks and troughs of the Gold price.
Until this ceases to work, my view is that Gold and Silver, not to mention Copper, likely have a “tough road” ahead in the coming months, given rates starting to turn back higher.
Gold Cycle Composite from 2018 to 2024