




Near-term US Equity trends still look constructive given no ^SPX trend break, with the rising trendline from April lows intact and the Russell 3000 A/D line continuing to confirm. However, momentum has begun to slip beneath the surface as price grinds toward the 7,500 area I had been targeting, and the cross-currents I have been cataloging continue to build into a possible peak next week as NVDA earnings are set to take place on Wednesday. The most notable single development today is the FXI breakout above its multi-month descending trendline, which is happening directly ahead of the planned Trump/Xi meeting this week and aligns with broader Dollar weakness as USD/JPY tests the multi-year rising trendline from March 2025 lows. On the macro side, long rates continue to push higher with ^TNX approaching the descending resistance.
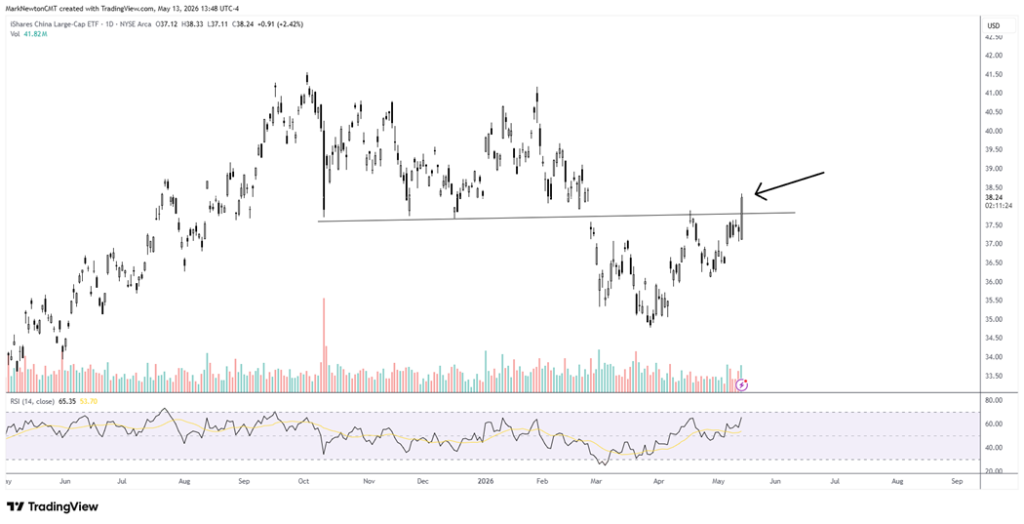
FXI breaks out above the multi-month descending trendline ahead of the Trump/Xi meeting this week
iShares China Large-Cap ETF (FXI) closed Wednesday at $38.26, up 2.42% on the session, breaking out above the multi-month consolidation pattern that had intersected multiple lows from last fall, along with a key peak in the month of April.
The breakout comes directly ahead of the planned Trump/Xi meeting later this week and is happening at a time when the broader Dollar backdrop has begun to soften, with USD/JPY testing the multi-year rising trendline from March 2025 lows as discussed in a section below. Given the timing of the meeting and the technical structure now in place, today’s price action looks to be the most actionable single development across the universe I am following.
Volume made a meaningful jump and expanded by the most since last fall. That’s important and, along with the breakout, serves to confirm that Wednesday’s move had some bullish significance ahead of the coming Trump/Xi meeting.
Given that this coming meeting could result in several positive developments, my feeling is that it’s right to be long Chinese equities, given today’s breakout, and expect that a falling US Dollar could help to provide a tailwind to this move.
I had discussed CQQQ, FXI, and KWEB as liquid ETFs to capture a possible rally in China, and I still feel that CQQQ is the most attractive at this time among these three.
Targets for FXI, shown below, lie initially at $41.55, while CQQQ could rise to $60. KWEB, not shown, looks to be starting a strong counter-trend bounce, and my technical thinking is that a push up to $34 should happen initially in the near future.
iShares China Large-Cap ETF (FXI) – Breakout above the multi-month trendline from October 2025 highs comes ahead of the Trump/Xi meeting this week
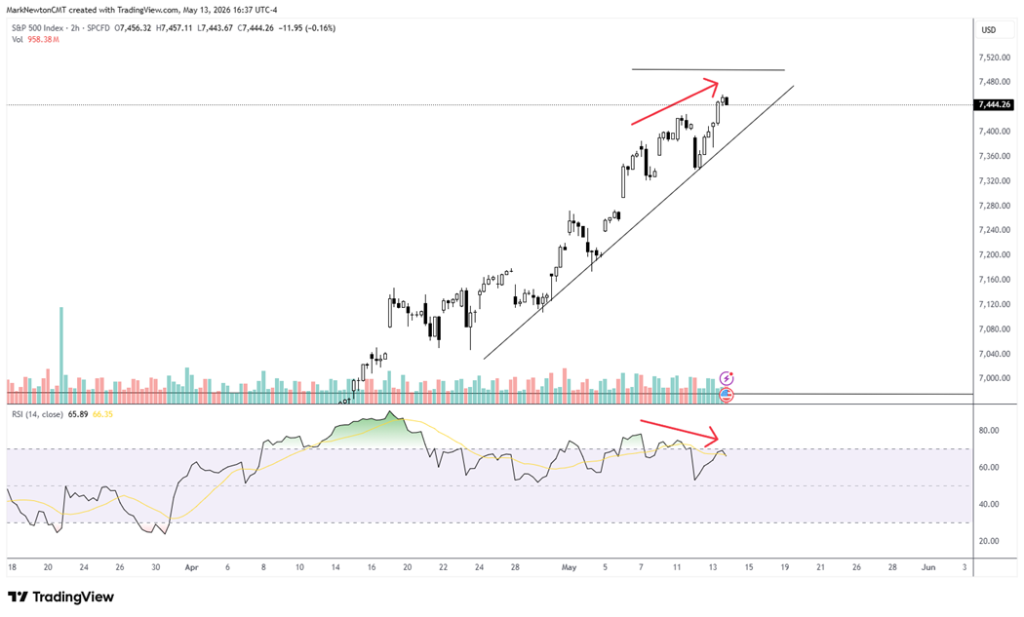
Still bullish on ^SPX given no trend break, but 2-hour momentum has been declining for the last week as price continues to push higher
^SPX closed Tuesday at 7,444.26, up roughly +0.58% on the session, but 9 of 11 sectors finished lower while market breadth came in negative again for Wednesday.
The 7,500 ceiling I had been targeting remains the area where this move likely encounters meaningful resistance and might happen into early next week, ahead of/into NVDA earnings.
S&P 500 Index (^SPX) 2-hour – Price continues to push higher toward 7,500, while momentum on the 2-hour chart has been declining for the last week
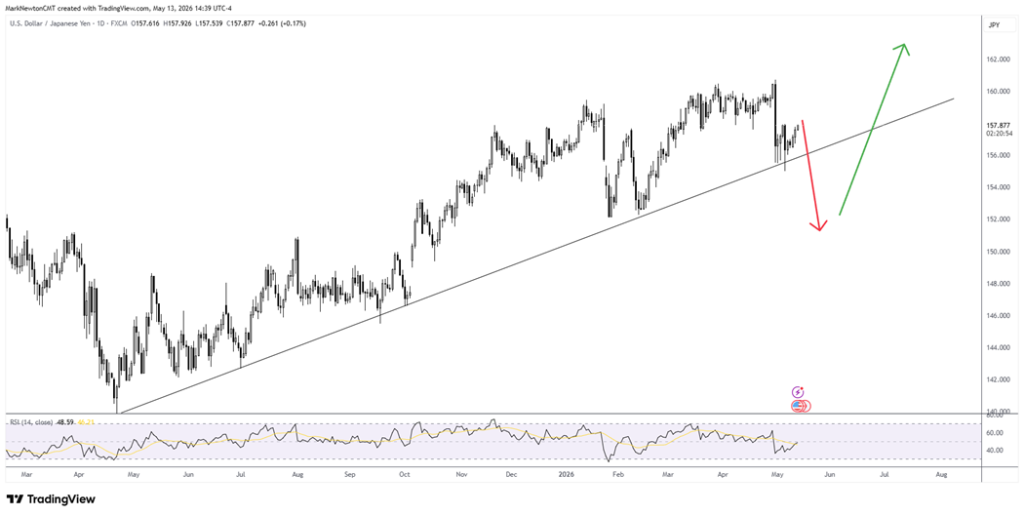
USD/JPY at the multi-year rising trendline from March 2025 lows is the macro inflection that gates the FXI breakout
USD/JPY closed at 157.88, sitting directly on the multi-year rising trendline from the March 2025 lows after having pulled back from the 160 area in recent sessions. This is the macro key to the FXI breakout discussed above, and my expectation is for a weaker US Dollar and temporary Yen strength against the Dollar over the next 1–2 months.
While a short-term selloff is certainly possible for USD/JPY, the longer-term trend and cycles argue that the Yen should eventually begin to decline back to new lows.
Thus, any near-term strength likely could prove short-lived but looks imminent in the weeks to come.
US Dollar / Japanese Yen (USD/JPY) – Multi-year rising trendline from March 2025 lows being tested at 157.88 as the macro tailwind to the FXI breakout
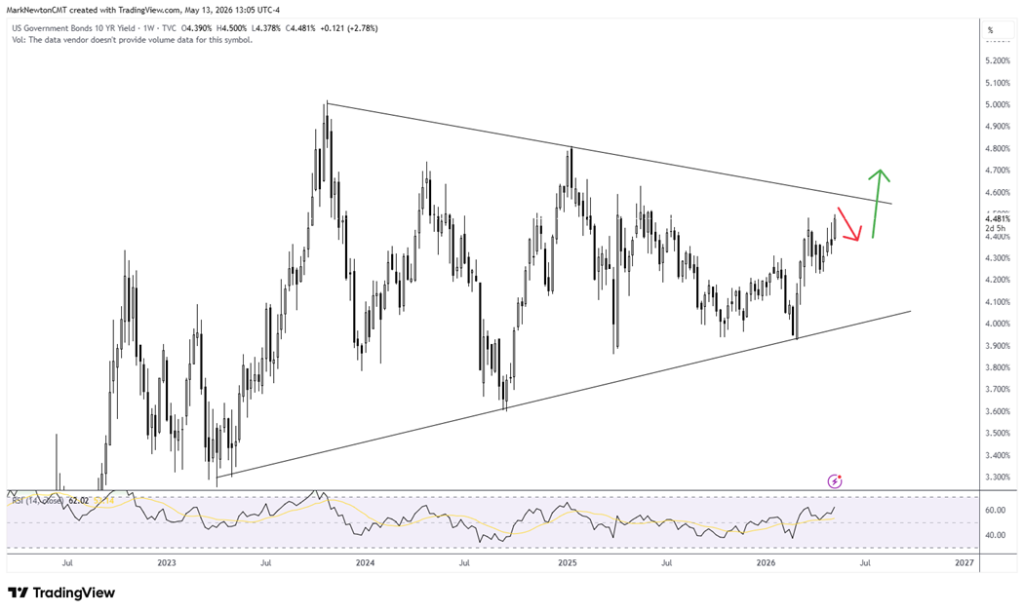
^TNX stalls briefly near March intra-day peaks, yet pullbacks should prove brief before a push higher to test and exceed 4.60%
The 10-year Treasury yield inched ever so slightly higher after Wednesday’s hot PPI number, yet appeared to stall near March intra-month peaks.
Overall, while this area might hold in the short run, any minor consolidation for yields should prove brief ahead of a coming push higher to test and exceed 4.60%.
Such a move would be important as it represents the multi-year symmetrical triangle that frames the rate picture. On the downside, I am skeptical that the 5/7 yield lows would be violated, which lie near 4.316%. Thus, minor pullbacks in yield likely could hold near 4.40% before turning back higher to achieve a larger triangle breakout.
It’s my expectation that a big jump in rates at the long end should serve as a possible catalyst for temporary equity weakness.
US 10-Year Treasury Yield (^TNX) Weekly – Multi-year symmetrical triangle at the descending resistance from the 2023 5.00% peak; weekly close above the line would confirm the multi-year breakout
Source: TradingView
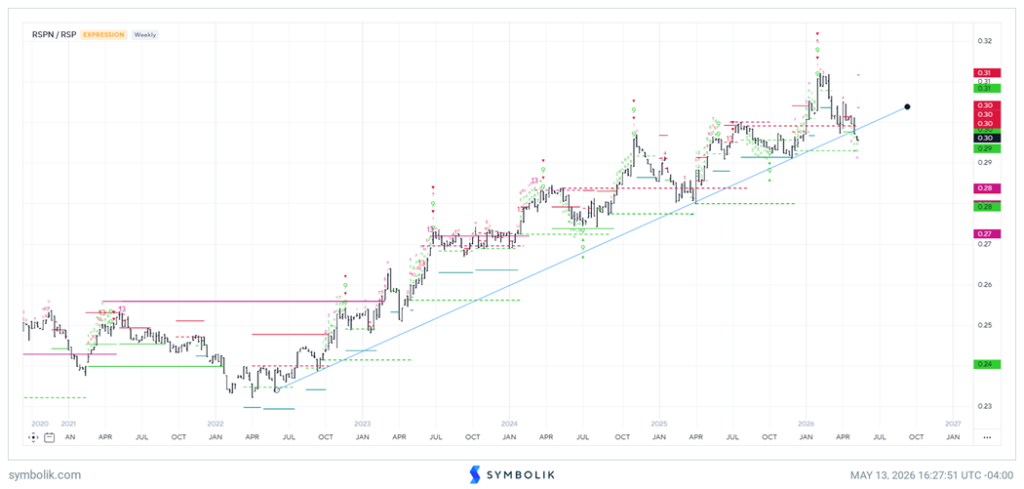
RGI/RSP weekly has broken the multi-year rising trendline; a trendline break is normally not an immediate buy signal — let Industrials stabilize before re-engaging
The weekly ratio of Invesco S&P 500 Equal-Weight Industrials (RGI) versus Invesco S&P 500 Equal-Weight (RSP) has broken beneath the multi-year rising trendline from the 2022 lows. This is an interesting development because it argues that Industrials has weakened on a relative basis at a pace beyond what I had been expecting, and the technical break makes the sector temporarily weaker than the intermediate-term thesis suggested.
A trendline break is normally not an immediate buy signal. It is important for this ratio to stabilize and not violate the prior low, which sits in the visible support zone near the 0.28–0.29 area on the chart. Until that stabilization occurs and the ratio begins to build a base without taking out the prior low, the right posture is patience.
Areas within Industrials, such as Defense stocks, have been under pressure as markets have started to sniff out a possible end to the war. However, many Airlines have come under near-term pressure given the higher oil prices in the last week.
The intermediate-term preference for Industrials within the broader sector book remains intact given the cyclical setup, but the near-term technical break argues for letting this sector consolidate a bit before re-engaging.
Invesco S&P 500 Equal-Weight Industrials / Equal-Weight S&P 500 (RGI / RSP) Weekly – Multi-year rising trendline from 2022 lows has been broken; not an immediate buy signal
Bottom Line
- FXI: Broke out above the multi-month neutral trendline and could accelerate up into/past the coming Trump/Xi meeting. Favor CQQQ, but KWEB looks to be catching up.
- USD/JPY: Looks close to rolling over; generally expect gains in the Yen as the US Dollar weakens against many of the majors in the next month.
- ^SPX: Still bullish given no trend break; rising trendline near 7,400 is the “line in the sand,” but momentum continues to make lower highs via RSI, which is a concern.
- ^TNX: Weekly looks to have stalled in the short run, but I expect a push higher next month to exceed 4.60%. This could be troublesome for stocks given a break of a symmetrical triangle pattern.
- RGI/RSP: Weekly has broken the multi-year rising trendline; not an immediate buy signal, but Industrials remains an Overweight. Let the ratio stabilize.
______________________________
PS: If you are enjoying our service and its evidence-based approach, please leave us a positive 5-star review on Google reviews —> Click here.