




Near-term equity trends remain intact, and Monday’s selling was mild by any reasonable measure, with breadth running roughly three-to-two negative and four sectors down more than 1%. What stood out was where the damage landed. The equal-weighted ^SPX and the Dow continued to drip lower while QQQ finished down only 0.16%, so this was not a Technology problem, and yet more than half the sectors closed at new two-day lows even though the headline indices barely moved. The real story came out of Japan overnight, where a soft GDP print alongside a hotter deflator sent JGB yields higher and dragged the long end of the US curve right along with it. Volatility turned up off the low end of its range in response, while the precious metals extended the recovery that began in early August. Technically speaking, it’s right to stay long here, but the mid-month cycle turn discussed last week could be getting underway with the tape finally showing some minor cracks, and technically the next couple of days will be important in either confirming this or showing one more push higher before some consolidation gets underway.
The uptrend in equal-weighted ^SPX broke Monday, while DJIA has been trending down for the last two weeks
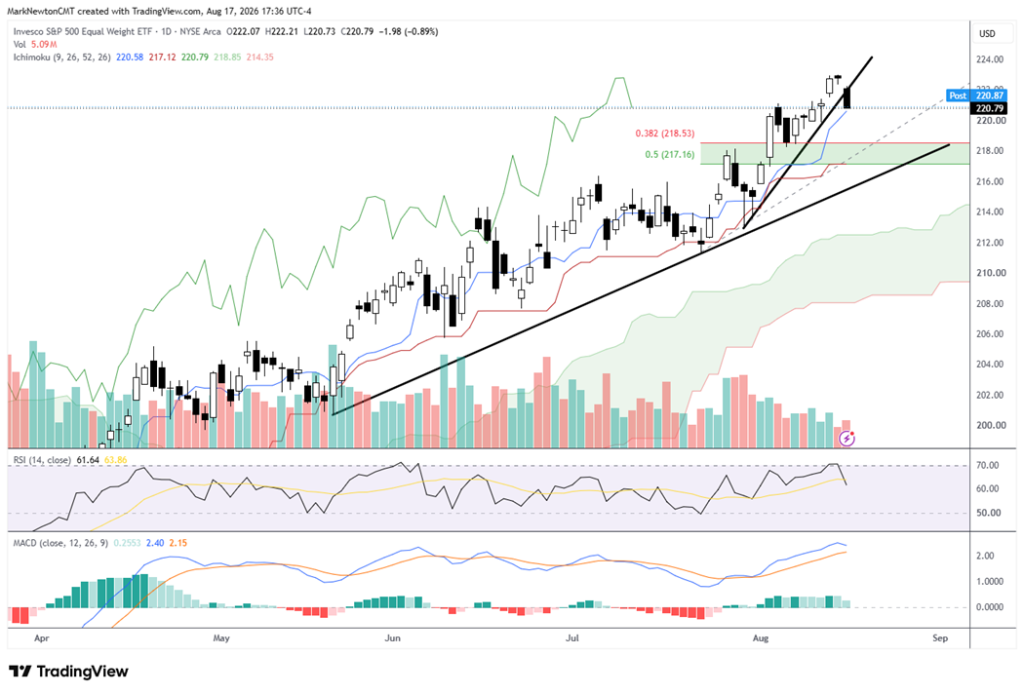
RSP fell -0.89% Monday and closed within a nickel of the session lows, breaking the rising trendline off the early-August lows on volume that was nothing special. A TD Combo sell signal has now registered on the equal-weighted ^SPX, and while it has not been confirmed, its arrival alongside the mid-month cycle turn discussed last week is enough to make me think a short-term minor consolidation is a real possibility. The level I’m watching is the initial Ichimoku conversion line at 220.58, essentially right where Monday closed, and I want to see ^SPX, QQQ, and RSP all finish beneath their respective Ichimoku-based conversion lines before treating this as anything more than a dip. (Note, this occurred for ^SPX, but for QQQ this lies at 721.54.)
Overall, price could give back a third to a half of the advance since late July and still do no meaningful technical damage at all. That takes RSP down into the 218.53–217.16 band, where the 38.2% and 50% retracements sit alongside the Kijun-sen at 217.12 and the longer rising trendline off the April lows, and I’d expect that band to hold on a first test. A similar area for ^SPX lies near 7,565.
It’s worth remembering that Monday was a mild session; the equal-weighted index and the Dow did the dripping while Technology barely participated. The next couple of days will hold the key as to what’s in store, but even on a selloff, I expect this to prove extremely short-lived at this time.
Invesco S&P 500 Equal Weight ETF (RSP, daily) — Monday’s trendline break puts the focus on the Ichimoku conversion line at 220.58, with a break under leading to 218.51
Thirty-year Treasury yields at 19-year highs is the development that matters most out of Monday
Monday’s US bond selloff followed directly on what Japanese government bonds did overnight, and the auction results and US FOMC minutes are also relevant for this week. Headline GDP for Japan printed at 1.1%, well below forecast, but the deflator came in above estimates, and that combination is what hurt the long end. Ten-year and twenty-year JGB yields pushed higher, and it spilled right over into US markets, driving the long bond to new multi-year highs.
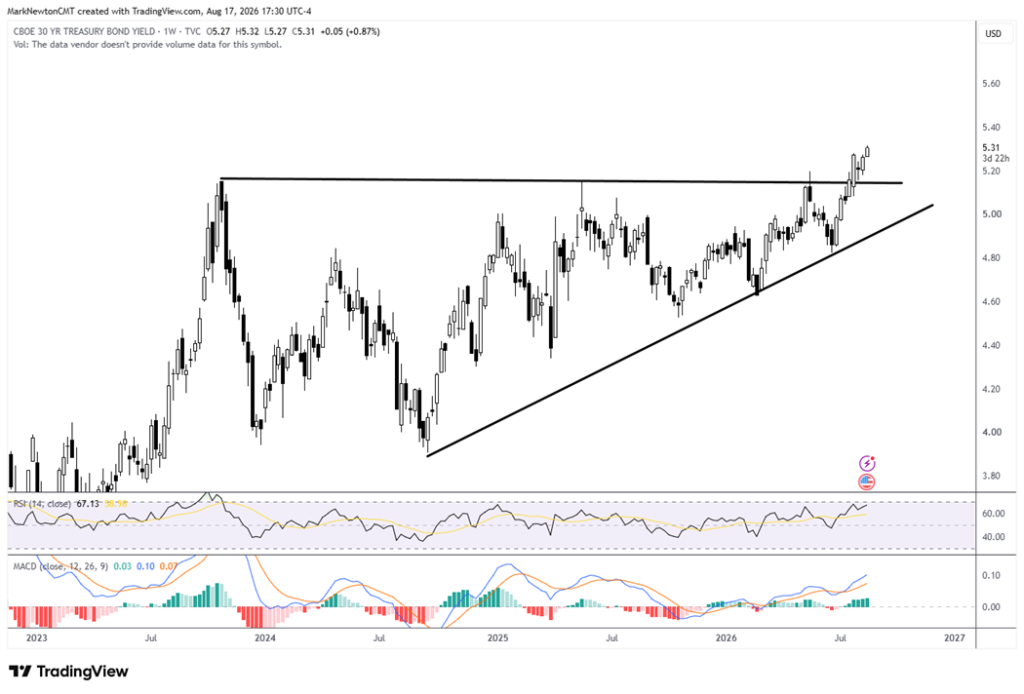
Monday’s daily close finished above the July 31 high, putting ^TYX at 5.31% and the highest levels on a daily closing basis in nineteen years. Long-term yields look likely to push up to 5.60–5.70% and likely move up at a quicker pace than normal given the recent resolution of this three-year triangle pattern.
^TNX has not yet done this, and it needs to be watched very carefully, but I suspect that move is right around the corner, with movement over the July peak at 4.745% opening up a faster run toward 5.00%.
It’s likely going to be difficult for equity markets to completely ignore an acceleration higher in Treasury yields. The rate-sensitive groups are where the pressure normally surfaces first, and both Utilities and REITs broke down relative to the S&P 500 in recent weeks.
CBOE 30-Year Treasury Bond Yield (^TYX, weekly) — Yields at nineteen-year highs resolve a three-year ascending triangle to the upside
VIX rising while equities barely sold off is the piece worth paying attention to
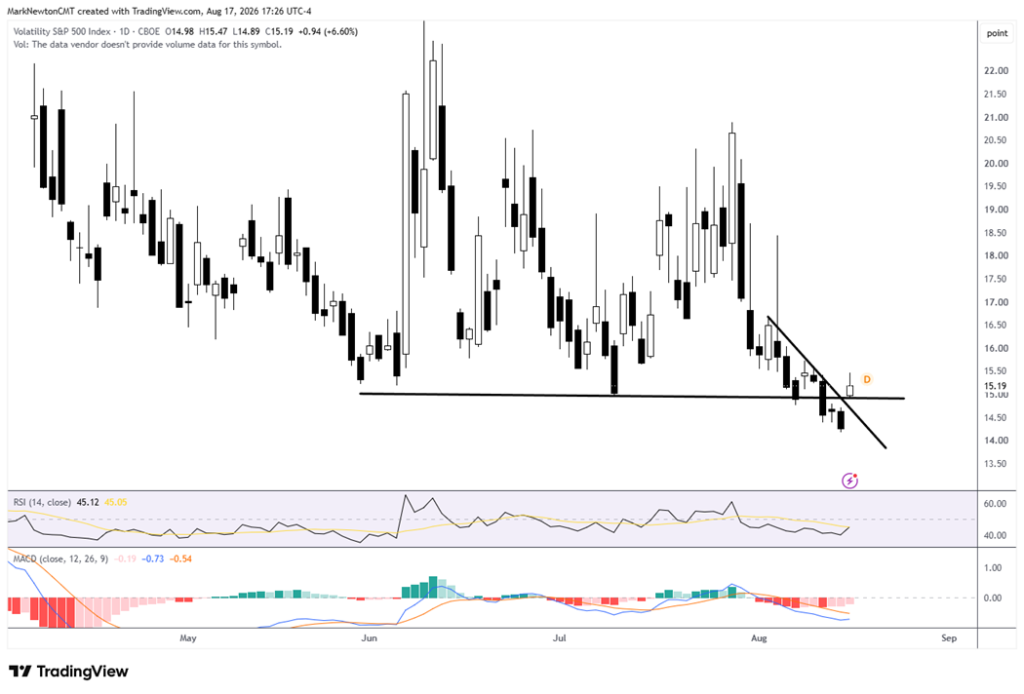
VIX jumped 6.6% Monday to 15.19 and new three-day highs, and it has now recouped the last two lows of the past few months after briefly attempting to undercut them. A false breakdown that reverses sometimes can prove to be a better tell than the breakdown itself.
What makes Monday interesting is that implied volatility rose even though neither ^SPX nor QQQ really showed much selling pressure, and it always pays to keep a close eye on the VIX because it will sometimes start to turn higher ahead of when equities turn lower.
My read is that this is letting us know we’re entering a period of possible cross-asset volatility: crude oil starting to push higher, the Treasury market selling off with long bond yields going higher, and equities doing some minor backing and filling after the progress of the last few weeks. Given that equities are entering a seasonally difficult time, I suspect that implied volatility likely can begin a slow grind back to former June/July highs in the low 20s into October.
Volatility S&P 500 Index (^VIX, daily) — Monday’s jump to three-day highs holds the lows of the last few months and breaks the recent downtrend
Silver should push into the upper 60s or lower 70s before a minor peak, and dips in the metals are to be bought
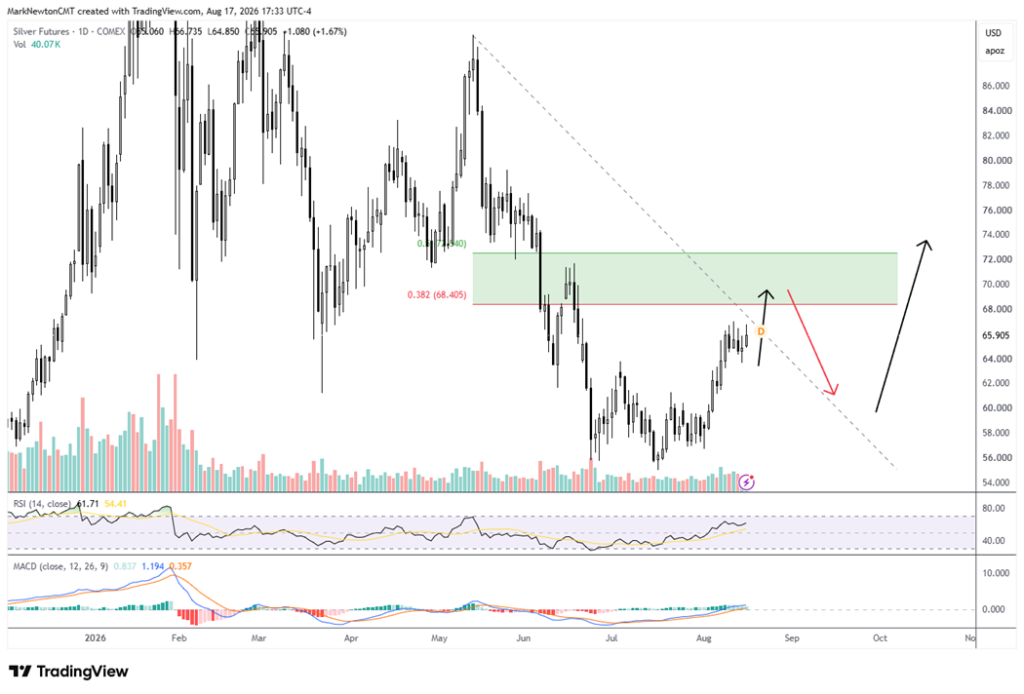
Silver closed at new three-day highs Monday and has gone sideways for the last week, not dissimilar from gold, which finished up a little less than 1%. It’s increasingly looking likely that silver pushes up into the upper 60s and lower 70s before making a minor peak, which lines up with the descending line from the early-May peak and with the 38.2% and 50% retracements of the May-to-July decline at 68.405 and 71.94. What’s interesting is that this move is happening while rates have been pushing higher, which is not the relationship most would expect.
In the short run, I think we get one more move up in the metals before backing and filling over the next couple of weeks. More generally, the metals very well could have bottomed in the middle part of July, and I’m less apt to think a move back to new lows happens right away. The Materials sector broke out, and there’s been very good strength out of a lot of the precious metals and base metals stocks.
It’s right to own the metals here and look to buy weakness when it comes, which likely starts in a couple of weeks. Buy dips in both gold and silver.
Silver Futures (SI1!, daily) — New three-day highs after a week of sideways action, with the descending line from May and the 68.405–71.94 retracement zone overhead
______________________________
PS: If you are enjoying our service and its evidence-based approach, please leave us a positive 5-star review on Google reviews —> Click here.