







Equity trends turned back up on Thursday, with both ^SPX and QQQ clearing the short-term resistance that had capped this consolidation since the mid-August peak, 7,727 and 712 respectively. What has changed over the last couple of weeks runs deeper than one earnings report, and the three developments driving it are laid out below. Long-term yields remain the risk of the next couple of months, and Warsh’s speech at Jackson Hole on Friday is the near-term event that either settles or unsettles that question, though neither crude nor the long end looks ready to spoil this just yet. A soft dollar continues to underpin the commodity trade. Breadth and the equal-weighted indices are the piece still left to prove itself here, and I would want to see them follow. It’s right to lean bullish and to use dips as an opportunity to add exposure.
Three key developments over the last couple of weeks remain the focus:
The three key developments of the last couple of weeks revolve around the following:
- Treasury Secretary Bessent’s proclamation of a doubling of the buybacks. While the size and extent are not known, this has resulted in a big breakout in precious metals, cryptocurrencies, and emerging-market currencies, along with a decline in the US dollar. Rates could certainly attempt to push higher in September if Warsh fails to add some clarity as to the Fed’s reaction function, but it seems comforting in the short run for global markets to have a “Treasury put” in the event rates start to turn higher aggressively in the US, regardless of how effective. The breakdown in the US dollar, discussed earlier this week, certainly seems like a big development following this announcement and should lead the dollar lower into next year.
- NVDA’s growth projections seem to be a game changer for the AI trade, suggesting that change could come at a faster pace than many expect. Its 2028 fiscal revenue forecast singlehandedly caused the stock to turn up sharply and looks to have been quite helpful in reigniting the Tech trade following nearly three months of lackluster consolidation and decline in many names.
- The endgame for the ceasefire negotiations is proving far more difficult than was thought to be the case a couple of months ago, and both Russia/Ukraine and US/Iran complications have helped to bolster the commodity trade. This likely results in precious and base metals, Energy, and grains spiking higher in the months to come. Precious metals and crypto have already begun this process, but grains look to play catchup given the breakouts in corn and wheat. This should bode well for Materials and Energy overweights this fall, which likely outperform, as well as Technology coming back.
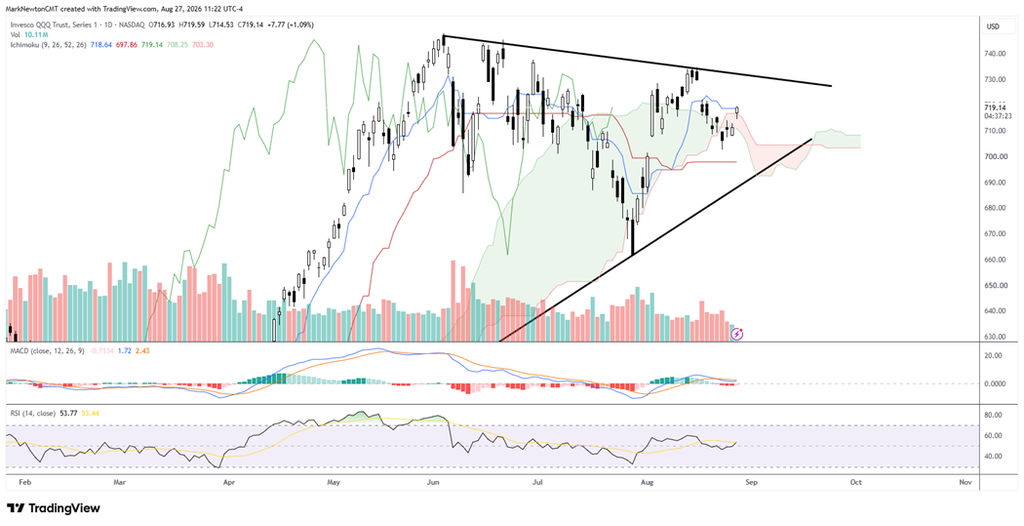
QQQ’s triangle breakout should carry it up to 729–734 with new all-time highs to follow
^SPX and QQQ both exceeded short-term resistance given NVDA’s surge on Thursday and look poised to continue higher into and after Warsh’s speech at Jackson Hole on Friday, which likely drives QQQ back to test and exceed all-time highs given Thursday’s triangle breakout.
Thursday’s close came near the highs of the session following a big range up to multi-day highs, and I expect QQQ pushes up to 729–734, an area of upside resistance near the highs of QQQ’s own triangle pattern which might prove important. The next 3–5 days are likely to show some bullish trend continuation, with the Tech trade playing catchup to the recent strength seen in cryptocurrencies and precious metals.
Invesco QQQ Trust (QQQ, daily) — Thursday’s break of the triangle that formed off the June peak, with 729–734 the next area of upside resistance
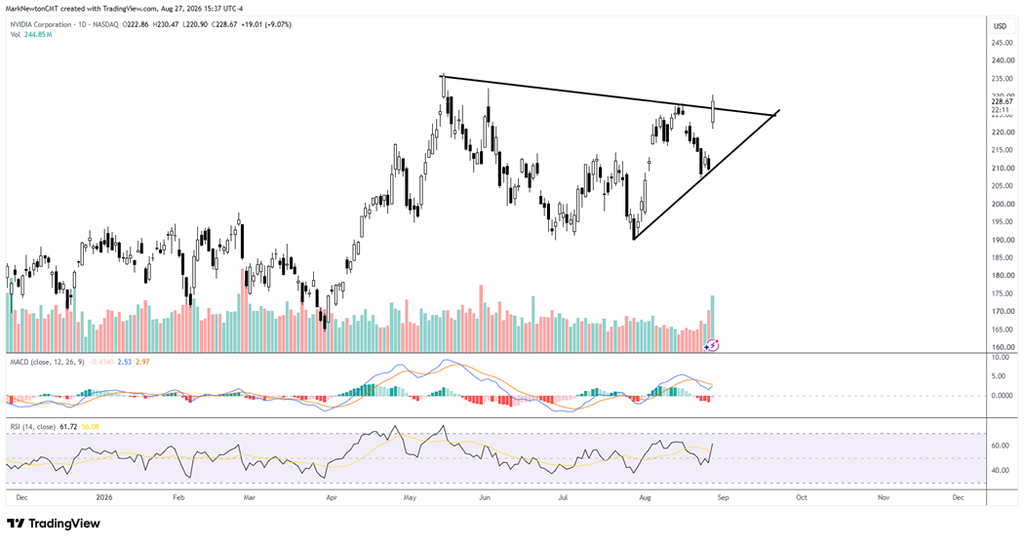
NVDA’s breakout from the May triangle came on the heaviest volume since late May
NVDA has broken out of the triangle pattern it has been building since May, and Thursday was the best trading day for the stock since February. Volume expanded to confirm the move, reaching the highest levels since late May, and that is what gives this breakout its weight.
The act of getting above the mid-August highs changes the NVDA pattern from May from one of consolidation to a bullish uptrend on a short-term basis, as part of a longer-term bullish intermediate-term uptrend. This is particularly bullish and should drive NVDA higher in the days ahead to test and exceed the May highs. Gains look likely initially up to $245, then $260.
Given NVDA’s weight within ^SPX and QQQ, this move is important and positive technically, and likely can drive US stock indices back to new high territory.
NVIDIA Corporation (NVDA, daily) — Thursday’s breakout from the triangle that began in May, with initial gains likely up to $245 and then $260
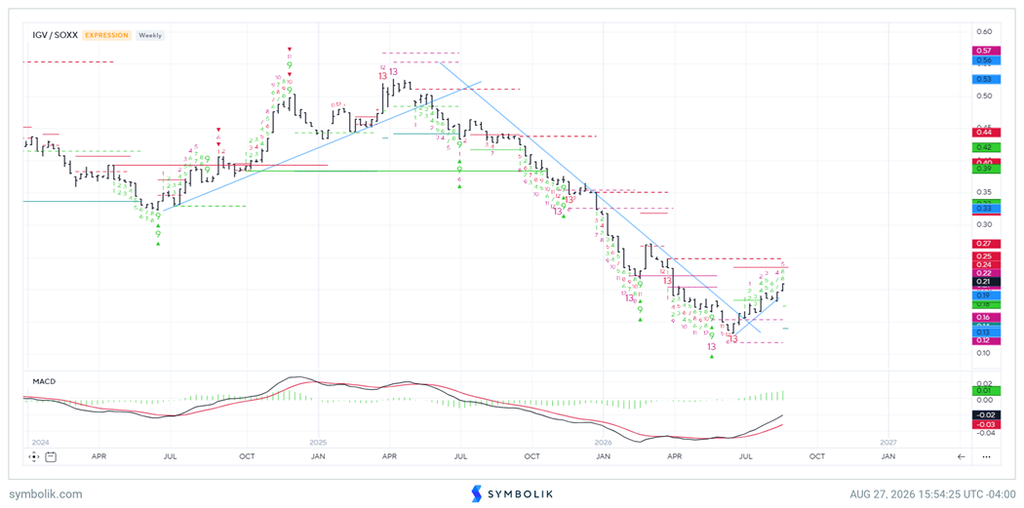
Software still looks stronger near-term than Semis, despite NVDA being Thursday’s catalyst
Arguably the focus within Technology remains on Software as a sub-sector which can outperform Semiconductors, despite NVDA’s move. The IGV/SOXX relative chart shows the big move in Software on Thursday, and IGV closed at the highest levels since last fall given strength in CRM, CRWD, SNPS, PANW, NOW, and FTNT, which were all up more than 9%.
So while NVDA is the stock of focus as the catalyst for Thursday’s surge, it’s actually Software behind the scenes that did most of the heavy lifting within Technology. IGV/SOXX shows the larger breakout which happened in Software (IGV) vs. Semis (SOXX) a few weeks ago, and this still points to Software outperformance.
It’s encouraging within Technology to see many parts of Tech all working well, which has been at odds with what most of the last couple of months has featured. Bottom line, it’s right to be long both Semis and Software, but Software still looks stronger near-term than either Memory or Semiconductor stocks when comparing sub-sectors.
IGV / SOXX (Software vs. Semiconductors, weekly) — The breakout that took place a few weeks ago remains intact, with IGV itself now at the highest levels since last fall
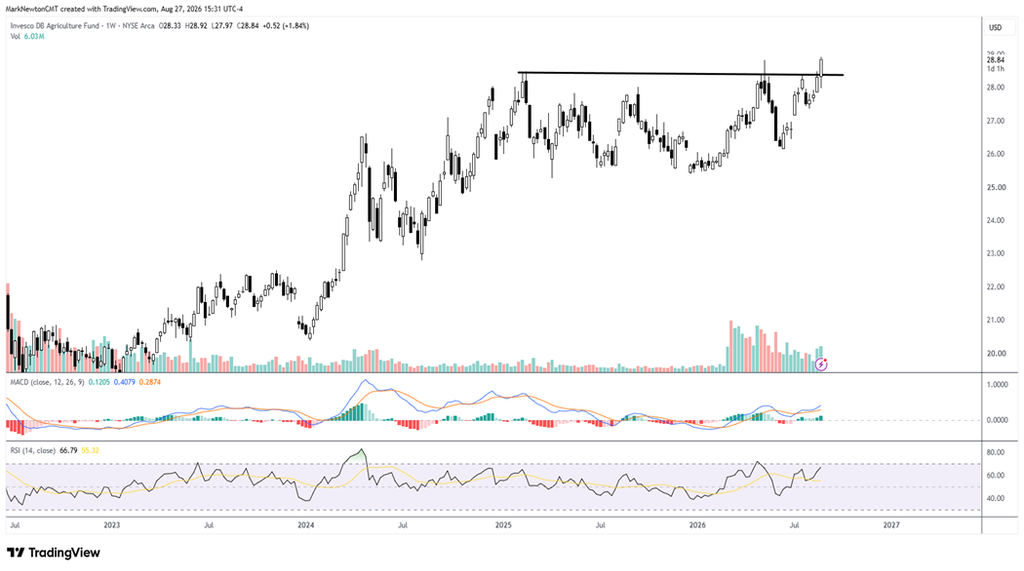
Grains breaking out puts DBA in position to clear a base that began in early 2025
Corn along with wheat are both higher by more than 5% in the last five trading sessions while soybeans is up to a lesser extent. The Invesco DB Agriculture ETF (DBA) looks attractive as a way to play this move, and I expect DBA to push into the mid-to-high $30s initially.
The weekly chart shows DBA set to clear a large technical base that began back in early 2025, and Thursday’s push up to 28.80 represents a weekly breakout with one day to go in the week. DBA was discussed back in the spring, and following a correction from May into June, the ability of this to have pushed back aggressively to new highs is seen as quite bullish.
Thus, Materials looks to gain further ground in the next couple of months, but arguably the grains look like a better risk/reward than the metals heading into September. As such, while dips in September in the precious and base metals should provide opportunity, the grains look immediately actionable and DBA is one ETF which can allow investors to have exposure to corn, wheat, and soybeans.
Invesco DB Agriculture Fund (DBA, weekly) — Thursday’s push to 28.80 represents a breakout of a large multi-year base for this grains ETF
______________________________
PS: If you are enjoying our service and its evidence-based approach, please leave us a positive 5-star review on Google reviews —> Click here.