




US equity trends remain positive despite the minor setback early this week, but Thursday’s stabilization in the wake of ongoing spikes in Treasury yields and crude strength seems like a positive, relatively speaking. ^SPX has given back roughly 50% of the prior gains from last Wednesday’s spike into early this week, and US indices appear to be an attractive risk/reward for a possible bounce on US/China trade optimism. The near-term patterns seem to suggest a bounce is near for equities, and the key will be to push up over this week’s highs, which should bring ^SPX and QQQ back to new high territory. However, the broader market is unlikely to show the same kind of strength, and this divergence will be something to watch carefully in the days/weeks ahead. The US Dollar Index seems to be up against strong resistance, while long yields have become overbought. Overall, the lack of material equity weakness today despite ^TNX finishing at 5.208% seems like a positive heading into the weekend. Both US and China trade delegates seem to have suggested some kind of progress was being made, and I think any hint of positive news might help spur a bounce Friday into early next week. Bottom line, until US equity indices begin to show more evidence of downside acceleration on this pullback attempt, it’s right to consider pullbacks as representing attractive risk/reward opportunities, not something which leads to meaningful weakness.
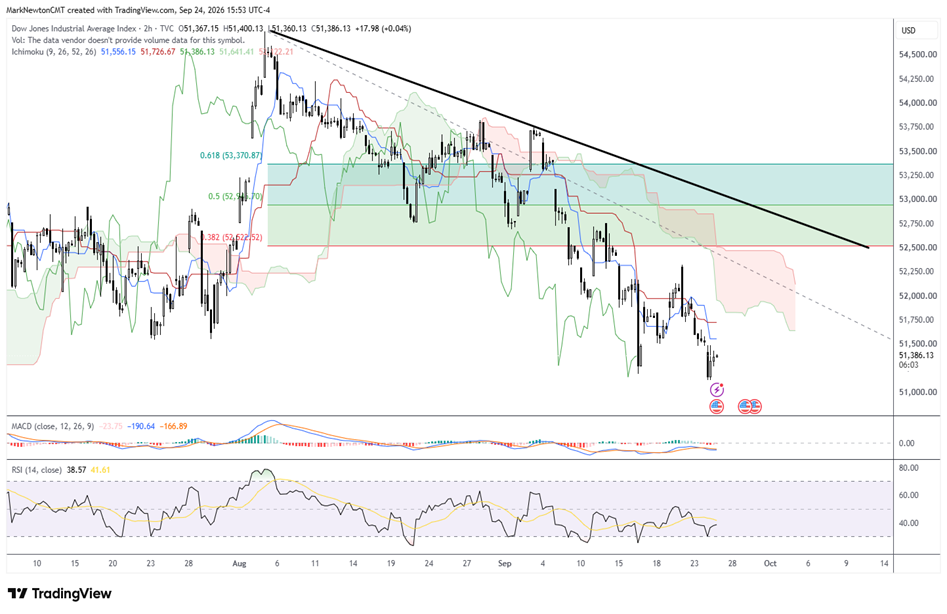
Dow Jones Industrial Average (DJIA, daily) — Recent selloff looks to be nearing support and could bounce into next week
DJIA looks to be arguably nearing support following six of the last seven “down” weeks, as the index has successfully tested the 38.2% Fibonacci retracement of the entire rally up from the 2026 lows into August.
While momentum has suffered some damage which will need to be repaired to suggest a move back to new highs can occur, the near-term wave structure coupled with DJIA’s ability to have reclaimed former lows that were broken this week looks like an initial positive.
The two key areas of technical importance on the upside lie at 52,324 at the most recent swing highs, followed by 52,760, which represents the meaningful low formed in late August. Following these levels, a break of the actual downtrend from mid-August would help momentum to show much more improvement and give more conviction regarding a push back to new highs.
Ideally, my expectations are for an initial bounce to the downtrend, found from 52,700–52,900 depending on how quickly DJIA reaches this level. Thereafter, some mild weakness is very possible from October into November, lining up with bearish midterm-year seasonality.
While QQQ and ^SPX look likely to push back to all-time highs, this looks to be a much tougher task for the technically weaker DJIA.
Getting some evidence of stabilization in averages like the DJ Transportation Average could serve to help the Industrials sector, which in turn could prove to be a positive for DJIA.
For now, the key message here is that divergences between DJIA and ^SPX are often important, and in this case, it’s vital for DJIA to start trending better to join the strength of ^SPX and QQQ, which in my view will begin to happen post-midterm elections.
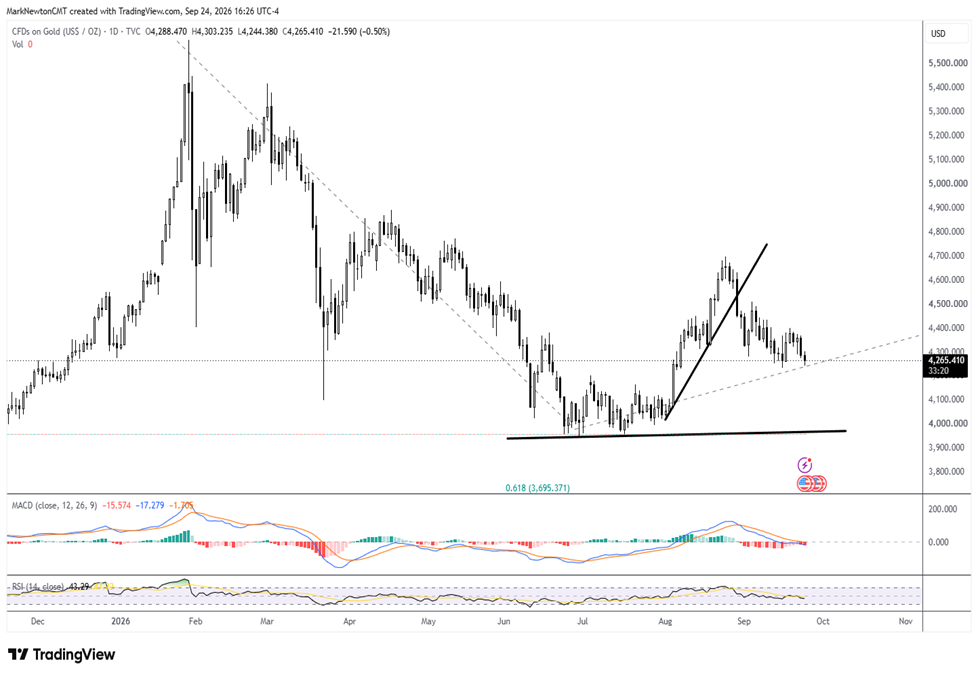
Gold slumping during a seasonally bullish period makes sense when considering the spike in real rates
Many investors have been disappointed that the initial rally off the summer lows has pulled back so sharply in recent weeks.
Much of this has to do with interest rates spiking, and historically, rates moving sharply higher normally makes a precious metals rally difficult, especially when real rates are at/near decade-high resistance.
Near term, my expectations are that possible weakness could happen into October, coinciding with additional weakness in the US Treasury market.
Seeing ^TNX move to 5.40% would likely keep a “lid” on gold for the near term, and technicals have grown a bit weaker in recent weeks.
The first meaningful level for gold lies at 4,234, and a break of this level would set up for a possible test of $4,000.
If price gets down to $4,000, my expectation is that this might be broken over the next 1–2 months, which would likely postpone any intermediate-term low until the mid-$3,000s.
Near term, given that gold peaked early this year as interest rates bottomed, I think it’s important to give long-term interest rates lots of attention for any indication of a peaking process in the works.
Until this can happen, it looks wise to avoid buying dips prematurely without evidence of technical proof of a bottoming out.
Bitcoin should be favored over gold until late October
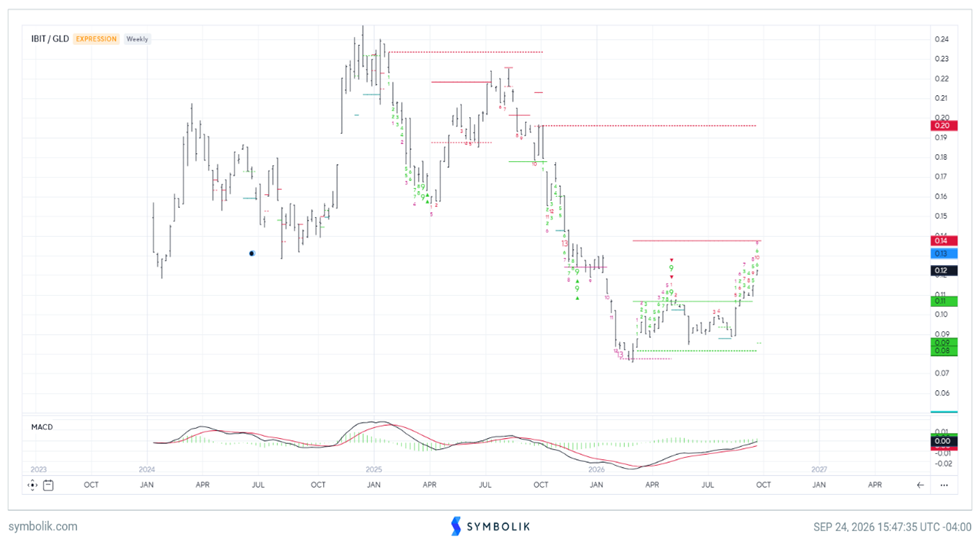
When comparing Bitcoin to gold to see which should be preferred during this time, the ratio charts of IBIT to GLD show a clear technical preference for Bitcoin, suggesting overweights in Bitcoin compared to gold between now and late October.
A few key positives to relay: First, the ratio chart has now reached the highest levels in about eight months, which is one positive. Second, weekly DeMark counts which successfully suggested that Bitcoin might begin to outperform gold produced and confirmed TD Combo weekly “13 Countdown” signals (Buy) on this relative pair back in March of this year. There was a brief TD Sell Setup in May, but last week the ratio just exceeded the prior peaks from back in May of this year. That’s another structural positive. Third, the DeMark count now points to 3–4 weeks possibly where Bitcoin should outperform gold when viewing the ETFs of both in ratio form.
Overall, despite gold being in a seasonally bullish time, it’s important to point out that Treasury yields are not acting like they do seasonally in September. Normally, Treasuries experience a bullish seasonal bias and rates pull back. This September has proven to be the opposite and rates have spiked sharply. Thus, this relative attractiveness in Bitcoin over gold makes sense, and my view is that it continues into October before this ratio reaches resistance and might possibly reverse course. The weekly IBIT/GLD chart is shown below by Symbolik.
iShares Bitcoin Trust vs. SPDR Gold Trust (IBIT/GLD) — Near-term strength could continue into late October
US crude bounce might not prove long-lasting if a deal can be carved out
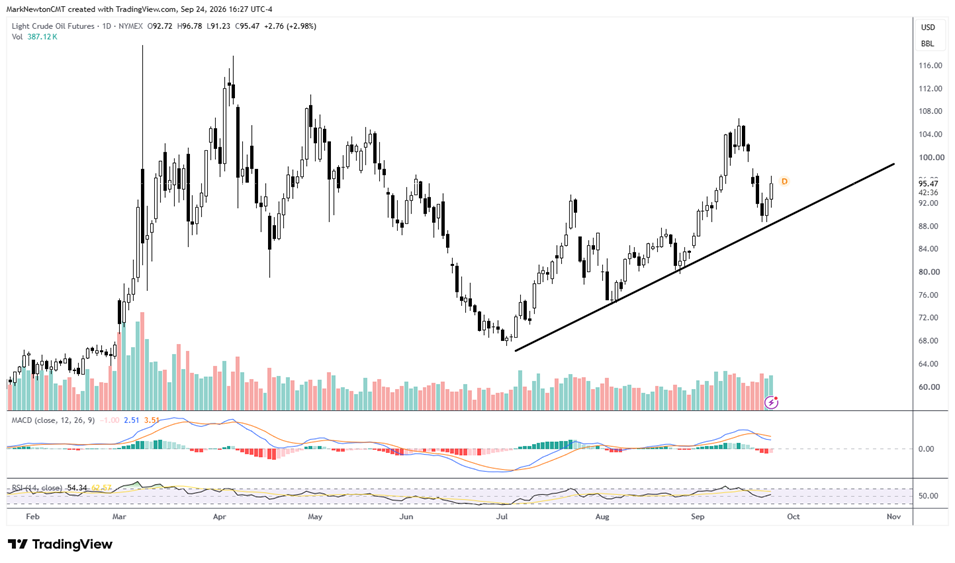
The hopes for some kind of larger US/Iran deal in exchange for lessening trade restrictions caused WTI crude to fall nearly $3 on an intraday basis today, but the last couple of days have still brought about some strength after an important test of three-month support.
As seen from this continuous WTI crude futures chart, crude has pushed up rhythmically from early July, and until this trend is broken, my expectations are that a bit more bounce can happen.
The most important technical development to watch would be a break of this three-month trend off the July lows, which currently lies near this week’s lows at $88.67.
Any break in this level argues for a much larger decline which could get underway into end of year before the weekly cycle strengthens into spring 2027.
The key takeaway is that a counter-trend bounce looks to be underway following a 15% decline in crude over five trading days’ time. Any failure of this move to reach $106.75 from mid-September before turning back lower merits paying serious attention, as this would result in momentum starting to turn down sharply on many Energy names.
For now, the technical opinion on Energy remains an Overweight, but it’s important to watch this three-month trend carefully for any evidence of being violated during the seasonally weak time of October/November this year.
WTI crude oil continuous futures — Held support on the recent pullback, but the bounce might not get back to highs
______________________________
PS: If you are enjoying our service and its evidence-based approach, please leave us a positive 5-star review on Google reviews —> Click here.