




US equity trends have turned decisively positive this week, as ^SPX has now joined QQQ in breaking out to new all-time highs, completing the consolidation that had been in place since mid-August, and importantly, this is happening as market breadth has made a sudden about-face higher following a dismal six weeks of decline, which looks like a short-term bottom in breadth. The rotation within Technology continues to shift, with Semiconductors, Software, and the “Magnificent 7” all looking relatively better than Memory stocks in the short run as Memory works off the damage from its July decline, while Healthcare, a technical Overweight, looks to need a period of consolidation following its sharp June–August rally, and Small-caps have yet to show the kind of relative strength that a steepening yield curve and improving breadth would normally produce. Cross-asset conditions remain the key variable, as the recent pressure from rising long-term yields, the US dollar, and crude oil has shown early signs of easing, and further relief on that front would likely accelerate the broadening that’s just getting started. Bottom line, it’s right to stay bullish on ^SPX and QQQ following this week’s breakout, to use any minor backing and filling as a buying opportunity for another 3–4 weeks of Technology strength and a slow push up to 7,900 into late October, and to continue favoring Technology while being patient with Healthcare in the near term and with Small-caps until relative charts confirm a turn. I’ll discuss more with charts and commentary in today’s report.
^SPX’s push back to new all-time highs is a very good sign for risk assets — it’s right to be long and bet on an “Up-tober,” with dips to 7,730–7,760 buyable ahead of 7,900
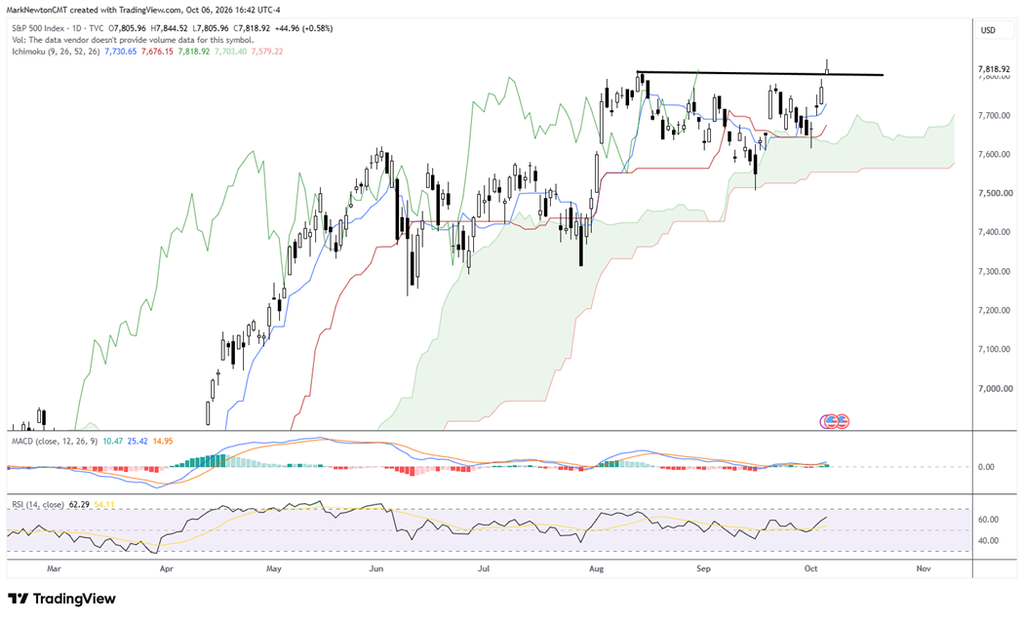
^SPX’s push back to new all-time high territory above the mid-August highs is a very good sign for risk assets, and it happened on 2:1 positive breadth, as seven sectors out of 11 rose more than 0.50% on the day. ^SPX rose 0.58% to close at 7,818.92, exceeding both the mid-August closing high of 7,798.99 and the intraday high of 7,816.70, which officially completes the consolidation that’s been in place since mid-August.
Despite a lack of true deterioration out of either Treasury yields or the US Dollar Index, equities have been able to push higher on Technology strength, which is slowly being aided by other sectors starting to rally back. While I don’t suspect this proves to be an easy task between now and the midterm elections, it’s right to be long, using dips as a chance to add to positions for another 3–4 weeks of Technology strength into late October.
Importantly, until sufficient evidence of either Technology peaking or indices starting to deteriorate happens (which might not occur until late October into mid-November), it’s right to ignore the possibility of a fall correction and simply bet on an “Up-tober.” I personally do not expect ^SPX to get to 8,000 ahead of November, but do feel that dips should prove minimal in price and time before a slow push up to 7,900.
S&P 500 Index (^SPX, daily) — Push back to new all-time highs above the mid-August peaks, with 7,730–7,760 strong support on any pullback ahead of 7,900
Has breadth bottomed? I suspect that’s the case in the short run, as Russell 3000 breadth has turned sharply higher following a dismal six weeks of decline
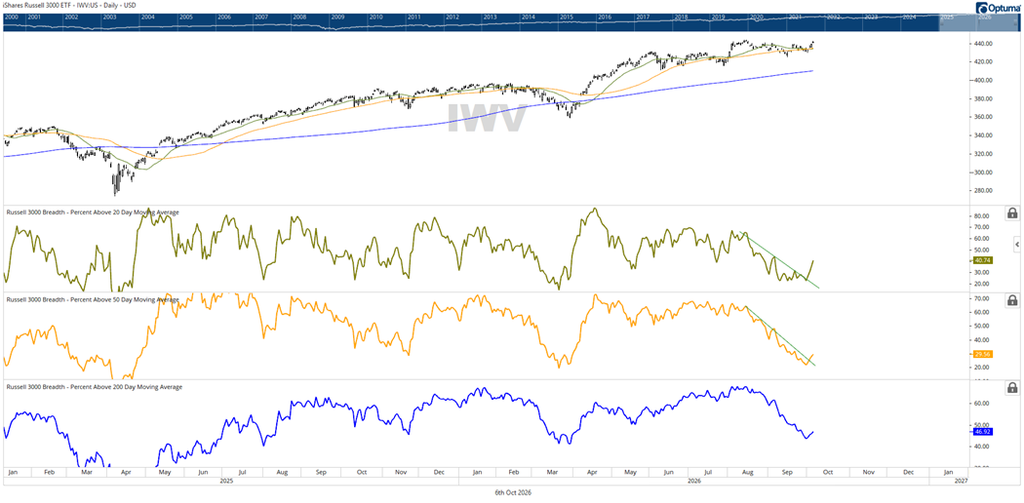
Has breadth bottomed? I suspect that’s the case in the short run. Russell 3000 breadth shows both the percentage of stocks above their 20-day and 50-day moving averages (m.a.) pushing back higher following a dismal six weeks of decline. As shown below, the percentage above the 20-day m.a. has risen to 40.7% from under 20% in late September, the percentage above the 50-day m.a. has bounced to 29.6%, and the percentage above the 200-day m.a. has turned up to 46.9%, with all three having bottomed at levels last seen at the spring 2026 lows.
The sudden about-face in market breadth higher is certainly a positive for US risk assets, and downtrend lines connecting this pullback in market breadth have been exceeded on both the percentage of stocks above their 20-day and 50-day m.a., and this likely expands further as Financials, Consumer Discretionary, Utilities, and Industrials show absolute gains. While Healthcare looks to be undergoing a mild correction, I don’t expect this to prove long-lasting.
Importantly, none of these readings approached the extremes seen at the April 2025 lows, which argues the broader market’s correction over the last six weeks was a consolidation within an uptrend rather than a meaningful decline. All three measures remain beneath 50%, so this is a turn in breadth rather than a broad-based advance just yet, and it’s important to watch carefully for evidence of breadth acceleration that could lead the Zweig breadth thrust to be confirmed. For now, this week has been a positive, and it’s proven to be far more broad-based than many would have suspected.
Russell 3000 Breadth — Percentage of stocks above their 20-, 50-, and 200-day moving averages (m.a.): a sharp about-face higher, with downtrend lines exceeded on the 20- and 50-day m.a.
Healthcare looks to require some consolidation after its sharp June–August rally — IBB has broken its uptrend from June and could decline toward $196, so it’s early to buy dips
Healthcare has begun to show signs that it might require some consolidation after a very sharp rally from June into mid-August. Pharmaceutical stocks, Medical Devices, and Biotech have all weakened in the last couple of weeks and could show further weakness in October before bottoming and turning back higher. While this sector is considered to be a technical Overweight, technically speaking, this doesn’t preclude occasional periods of consolidation following sharp gains, and this is exactly what looks to be happening now.
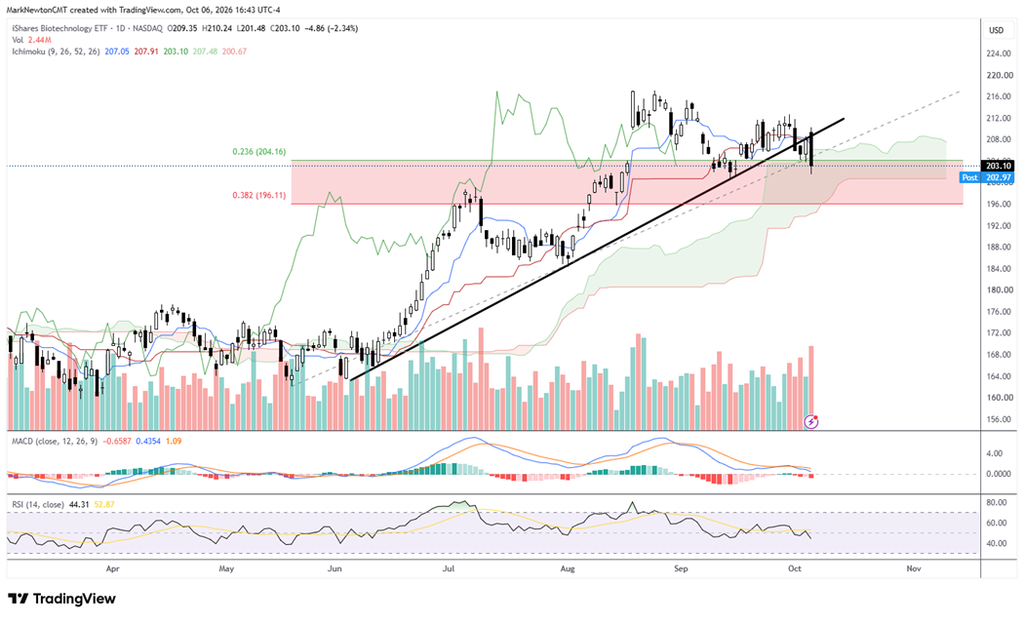
IBB, as a gauge for Biotechnology, officially broke its uptrend from June three trading days ago (last Thursday, 10/1/26) and looks to be susceptible to a potential 5% decline in the days/weeks ahead. This might result in IBB moving lower to $196, which lines up with the 38.2% retracement of the June–September rally at 196.11 and the bottom of the cloud, and it looks early to buy dips at present given the near-term technical weakness for those who are short-term oriented.
Overall, I don’t suspect this represents anything more than a short-term period of consolidation, as the larger structure of higher highs and higher lows from the spring remains intact, but many different parts of Healthcare look to be affected, and it’s wise to be patient on this sector in the near term. A daily close back above 208 would be needed to suggest the uptrend has resumed earlier than expected.
iShares Biotechnology ETF (IBB, daily) — Break of the uptrend from June on 10/1 argues for a potential 5% decline toward $196 before this consolidation runs its course
Why aren’t Memory stocks rapidly pushing back to highs? Patience is required, as Semiconductors, Software, and the “Magnificent 7” all look relatively better than Memory in the short run
Why aren’t Memory stocks rapidly pushing back to highs? Patience is required here also, but Semiconductor stocks look better, along with Software and many “Mag-7” names, in the short run. Many are concerned about the lack of strength in Memory stocks lately despite the push higher from the July lows, as the August–October churning has barely resulted in any true upside progress. I don’t think that means Memory should be avoided, technically speaking.
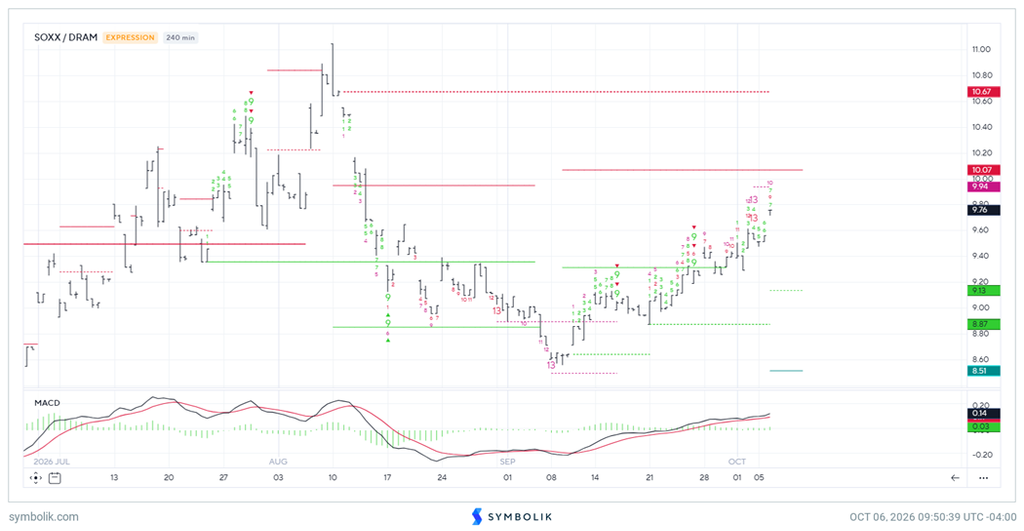
(For those seeking immediate alpha within Technology, I often find it helpful to run sub-sector ratio charts, which tend to clearly show pockets of strength and weakness.) In this case, SOXX (iShares Semiconductor ETF) has been trending up nicely relative to DRAM (a gauge for Memory stocks based on Roundhill’s Memory ETF). As shown below, this ratio has rallied from its early-September low near 8.51 to 9.76, and in the short run, “Semis” are decidedly more positive than Memory stocks.
Overall, my view is that the “Magnificent 7” along with Software and Semiconductors as sub-sectors all look relatively better than Memory stocks in the short run. As might be expected, this has zero to do with fundamentals and more to do with weakness in longer-term momentum following the steep drop in Memory names in July. (Rarely does technical analysis favor groups which have sold off 30–50% or more from all-time highs as being candidates for immediate mean reversion, which many might remember when attempting to buy initial dips in Software. This rule also applies to Memory stocks and simply warrants some near-term patience.)
SOXX / DRAM (Semiconductors vs. Memory stocks, 240-minute) — Decidedly positive trend for SOXX vs. DRAM since early September looks to continue in the near term
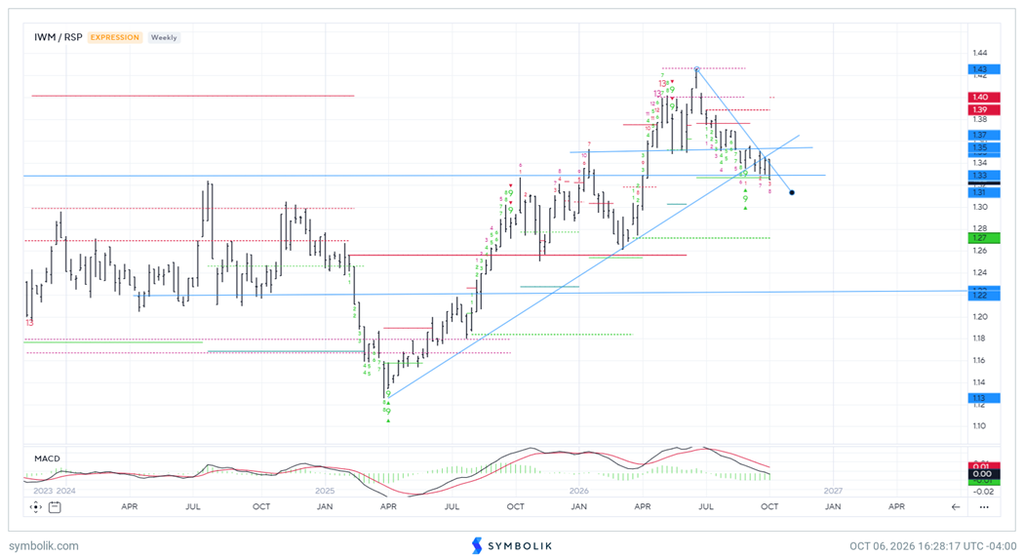
Small-caps look to be breaking trendline support vs. equal-weighted ^SPX given the selloff to the lowest area since spring 2026 in ratio charts
The weekly ratio of the iShares Russell 2000 ETF to the Invesco S&P 500 Equal Weight ETF (IWM/RSP) peaked in July near 1.43, right as a TD Sequential 13 Countdown signal registered, and has since declined steadily, breaking the uptrend from the April 2025 lows in September.
Weekly MACD remains negative, and the downtrend line from the July peak currently lies near 1.35, so Small-caps have yet to show the kind of relative turn that would be expected given the steepening in the yield curve discussed last night and this week’s improvement in breadth. A weekly close back above 1.35–1.37 would be the first real evidence that Small-caps are starting to outperform again, and that would be an important development for the broadening of this rally, as it would signal that the most rate-sensitive part of the market has begun to respond.
For now, Small-caps remain a group to be patient with rather than chase, and the minor 2–3 weeks of attempted stabilization looks to be giving way to weakness down to multi-month lows this week.
Unless an immediate about-face occurs over the balance of this week, I’m of the opinion that the recent consolidation within the Small-cap sector is continuing, aligning with the difficulty of interest rates turning back lower in the short run. Thus, while parts of the US stock market have definitely stabilized and turned higher, that hasn’t yet happened with Small-caps.
IWM / RSP (Small-caps vs. equal-weighted S&P 500, weekly) — Decline from the July peak has broken an uptrend in relative performance, suggesting Small-cap outperformance is premature
______________________________
PS: If you are enjoying our service and its evidence-based approach, please leave us a positive 5-star review on Google reviews —> Click here.