



Since peaking last Tuesday (1/22) at 3,338 (ATH), the S&P 500 has tumbled with two ugly back-to-back days, with equity markets now down 3% from ATH. While the sell-off is a mere two days, the velocity of the decline has pushed markets into oversold territory.
POINT: The TINA "put" comes into play if 30min RSI (14-period) <30 -- has been a "money" trade in all of 2019...The 30min RSI (14-period) is now oversold at <30 (see below) and the last 4 times this happened, it was a profitable entry point. In fact, this was true in the last 10 instances (from June 2019).
- As long as investors remain too long "cash," these pullbacks are bought. Think of it as TINA (there is no alternative) "put"
- And the TINA "put" is still in effect, as long as the Fed remains "easy" (check, yes) and yields are low (check, yes).
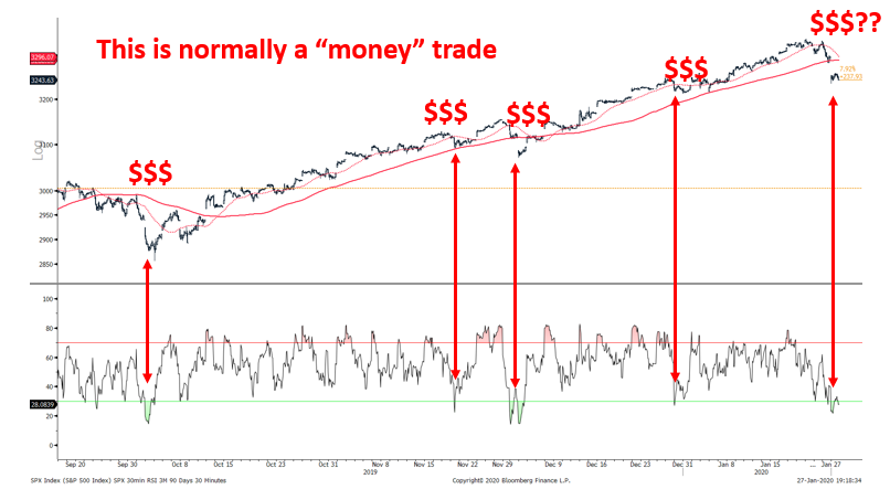
POINT: But the "wall of worry" has signs of a more than garden variety bad day...
Tempering the above view, we think a visit to the 50-day (5% correction) and even 100-day mavg (7%) might be warranted as a cumulative number of factors does heighten the risk that 1H Global GDP comes in the weak side:
- Boeing woes are having an impact on US GDP and was evidenced by the weak ISM readings (Dec survey reflected the announcements);
- Corona hypervigilance causing is going to cause short term and visible slowdown in China.
- 10-yr yields plunged and even the 5Y-1Y is inverted (puzzling)
- High-yield spreads have widened 50bp since last week (to 439 STW)
- VIX term structure nearly inverted on Monday (1/27)
- Moreover, using Tom DeMark combo sequential count, the upside target for S&P 500 has been "fulfilled" and thus, implies exhaustion of the uptrend in the near-term.
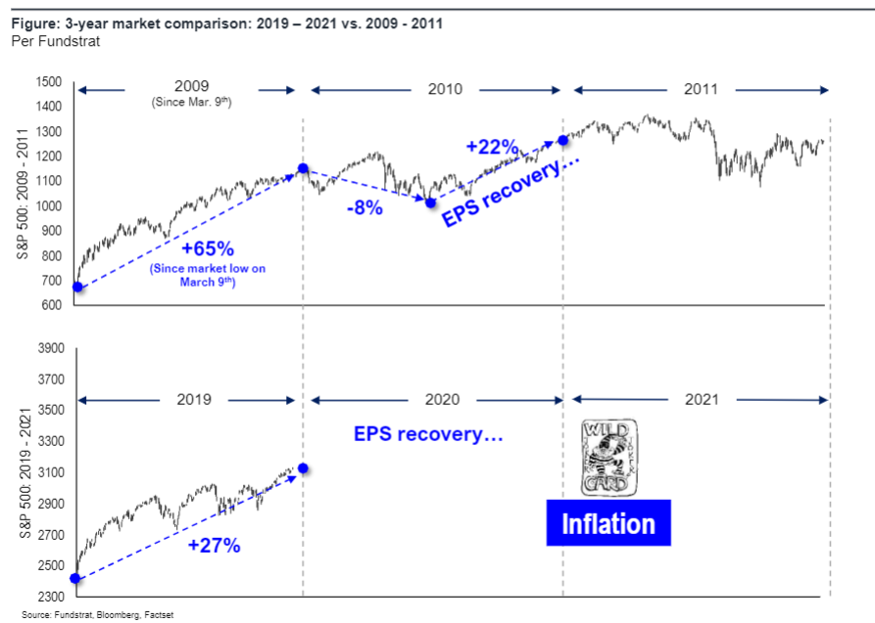
BOTTOM LINE: TINA "PUT" IN PLAY, BUT 5%-7% PULLBACK JUSTIFIED. We think more weakness likely in the next few weeks towards the 50D and probably 100D moving average, which is 3,195 and 3,095, respectively (5% to 7%). And this would be consistent with our 2020 thesis -- that 2020 would look a lot like 2010. Recall, at the start of 2019, we said 2019 would look a lot like 2009 (which it did).
And as shown below, in 2010, the 1H saw a mini-peak and then an 8% drawdown. So we would not be surprised to see a move to the 100D.
ONE FINAL NOTE: WE UPGRADED HEALTHCARE TO AN OW LAST FRIDAY, BUT IT WAS LOST IN THE CARNAGE...
We upgraded Healthcare to an OW last Friday. Previously, we had a Neutral since December 2015. The rationale for the upgrade is simple:
- Healthcare has produced reliable and steady growth in the past 5 years (EPS CAGR +9.6%) but P/E multiples have contracted as the cumulative headwinds (political backlash, extended valuation) contributed to a contraction of P/E from 17.8x (+0.3x vs S&P 500) to 16.9X (-2.3X discount).
- In 2019, uncertainty around Medicare for all (M4All) certainly amplified these concerns. But in 2020, risks have somewhat moderated as few Democratic Presidential candidates support such a move (only Sanders?) and as such, risks are diminished. This argues for equity risk premium to fall for Healthcare.
- Healthcare’s equity risk premia, 4.10% by our calculation, is highest for any sector in the S&P 500 based upon z-score (Slide 6). At -0.9X z-score (~0.9 std deviation from 30-yr long term avg of ERP), Healthcare has an even higher equity risk premium than Industrials and Cyclicals. This is somewhat surprising but also highlights the extent which perceived risk has re-priced the sector. A 100bp drop in ERP is 23% upside.
What is Fundstrat Direct?
Fundstrat Direct is a market-leading, independent research boutique. We are experts in U.S. macro market strategy research and have leveraged those fundamental market insights to become leading pioneers of digital assets and blockchain research.

Tom Lee's View
Proprietary roadmap and tools to navigate and outperform the equity market.

Macro and Technical Strategy
Our approach helps investors identify inflection points and changes in equity leadership.

Deep Research
Our pioneering research provides an understanding of fundamental valuations and risks, and critical benchmarking tools.

Videos
Our macro and crypto videos give subscribers a quick and easy-to-understand audiovisual updates on our latest research and views.

US Policy Analysis
Our 40-year D.C. veteran strategist cuts through the rhetoric to give investors the insight they need.