


“Courage is the most important of all the virtues because without courage, you can’t practice any other virtue consistently.” ― Maya Angelou
Chart of the Day
Good morning!
There’s even more research now that suggests that Americans are the ones who bore the burden of tariffs last year, but it does little to quell the debate on whether tariffs are a one-time increase or inflation causing.
Between January 2024 and November 2025, nearly 90% of the tariffs slapped on were paid for by U.S. companies and consumers, according to research published Thursday by the New York Fed’s Liberty Street Economics.
That’s far from an ideal outcome for the administration, which has repeatedly justified tariffs by making the case that foreign companies will be the ones left paying for the higher costs.
Still, to their credit, the fact that inflationary impact from tariffs remains missing has kept the debate open for the argument that tariffs very much could be a one-time price increase. The big question now becomes whether today’s inflation will report show anything to settle that debate. Economists expect January inflation will increase 0.3% from the previous month and 2.5% from the last year, which would be above the Federal Reserve’s target of 2%.
Of course, it’s possible the report comes in cooler than expected. In 2025, the headline inflation number came in below forecasts seven out of 10 times, while investors and economists remain stumped about where tariffs are.
Federal Reserve Chair Jerome Powell, too, seems to be pretty sure tariffs aren’t going to wreak havoc but is hesitant to end his inflation watch.
“The other thing is the pass-through—didn’t know how fast that was going to be to consumers, didn’t know how much exporters would take, how much companies in the middle would take, and how much the consumer would take,” Powell said at the January meeting. “And it turns out it’s a lot of companies in the middle—who, by the way, are pretty strongly committed to passing the rest of it through, which is one of the reasons why we need to keep our eye on inflation and not declare victory prematurely.”
He suggested that the reason why everyone’s worst-case scenario failed to materialize is not because their forecasts were off but because the rate implemented was much smaller than expected. (Remember that many walkbacks were made, something which even the New York Fed report discusses.)
Still, the weighted average applied tariff rate on all imports rises to 13.5% under the tariffs imposed and scheduled as of Feb. 6, and the average effective tariff rate, reflecting behavioral responses, rises to 9.9%—the highest average rate since 1946, according to data by the Tax Foundation.
To put the burden in context, this leads to an average tax increase of $1,300 in 2026 and $1,000 in 2025 per U.S. household. That’s not an egregious amount. However, it is certainly heavy enough that it shouldn’t be glossed over, and it could very well throw a not-insignificant percentage of consumers into debt, so I understand the Fed’s cautionary approach.
But at the same time, a job market that is booming solely because of healthcare and social-assistance jobs could surely use a lift via lower interest rates. I just don’t understand how much more evidence they need.
Share your thoughts
Should the Fed cut rates in March? Click here to send us your response.
📧✍️Here’s what a reader commented📧✍️
Q: What do you make of the current labor market?
A: You make excellent points that everyone except the Fed seems to understand. The job market is healthy in only a few places and those places that are healthy, e.g., health care, social services and government, don’t drive prosperity in a way that lifts people out of poverty! We’re short about a gazillion houses, depending on whose number you believe, and the Fed is keeping its boot on the neck of the housing industry.
Catch up with Fundstrat
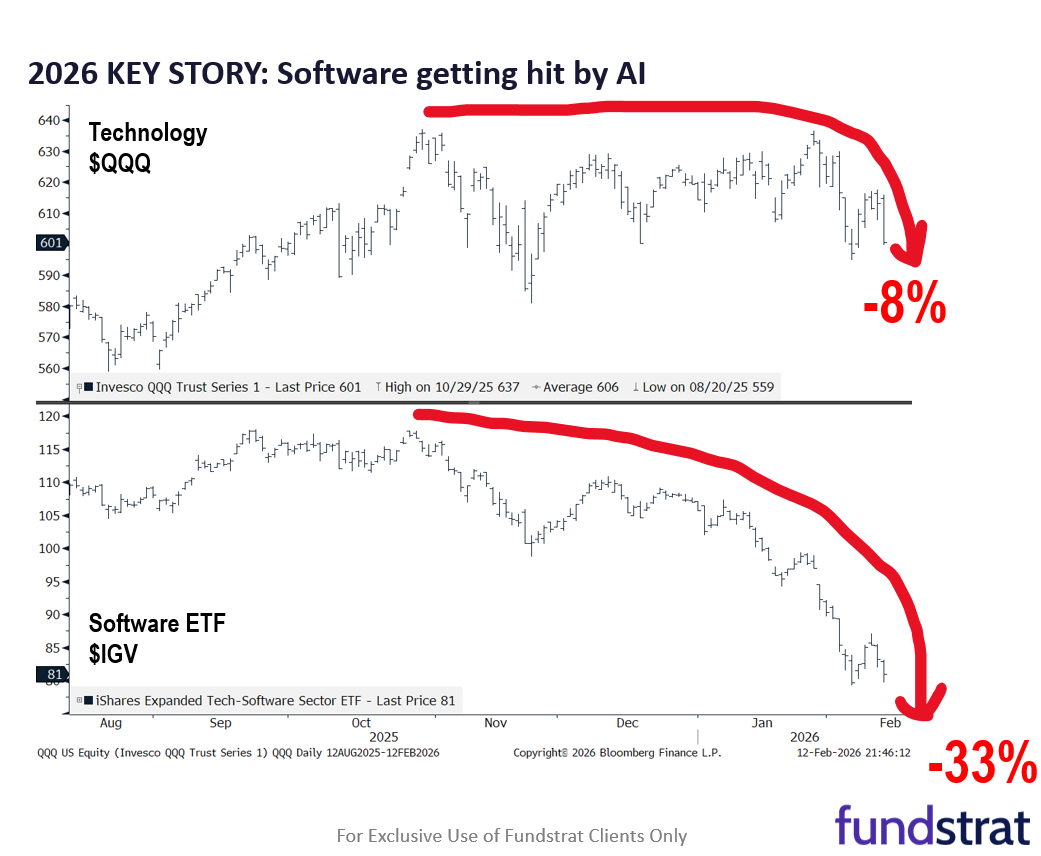
We realize it feels like a bear market out there because the story of ‘software eating the world’ (1980-2025) has now become one of AI eating software. This, coupled with rotations from Armies (Mag7) to Bulletmakers (semis, etc.), feels turbulent. To us, this is all an argument that AI is creating productivity and is disinflationary.
Technical
Thursday’s trading showed similar signs of the same type of rotation we’ve seen in recent weeks: A heavy push into defensive areas like consumer staples, while software and financials weakened sharply. Defensive positioning has grown stronger in recent weeks as sectors like REITS, telecoms, and utilities have now started to join the push higher in consumer staples.
Crypto
Bitcoin continues to trade more like a growth asset than digital gold, tracking equity style rotations and risk sentiment rather than pure store-of-value flows.
News We’re Following
Breaking News
- Consumer prices rose 2.4% annually in January, less than expected CNBC
Markets and economy
- US antitrust chief resigns amid tensions with other Trump officials BBC
- US, Taiwan finalise deal to cut tariffs, boost purchases of US goods REU
Business
- Goldman Sachs’s top lawyer to step down following latest Epstein documents WSJ
- Coinbase (COIN) posts $667 million loss, sees revenue tumble 20% BBG
- Schroders agrees £9.9bn takeover by US investment manager Nuveen FT
Politics
- Analysis: Trump takes victory lap after biggest climate rollback yet BBC
- The US slips to its lowest-ever rank in a global corruption index CNN
- Even Trump’s own appointees are ruling against ICE’s mass detention strategy POL
- Judge blocks US military from demoting Mark Kelly over ‘illegal orders’ video BBC
- DHS shutdown all but certain as Democrats and Trump White House can’t cut deal CNBC
Overseas
- Japan seizes Chinese fishing boat and arrests its skipper WSJ
- North Korea’s Kim positioning daughter as successor, Seoul spy agency briefing says REU
- Russia shuts down WhatsApp, pushes citizens to state-run app accused of being a ‘surveillance’ tool FoxB
Of Interest
- Australia counts sheep with AI to help farmers sleep easily FT
| Overnight | ||||||||||||||||||||||||||
| ||||||||||||||||||||||||||
| APAC | ||||||||||||||||||||||||||
| ||||||||||||||||||||||||||
| Europe | ||||||||||||||||||||||||||
| ||||||||||||||||||||||||||
| FX | ||||||||||||||||||||||||||
| ||||||||||||||||||||||||||
| UST Term Structure | ||||||||||||||||||||||||||
| ||||||||||||||||||||||||||
| USD HY OaS | ||||||||||||||||||||||||||
|
| Date | Time | Description | Estimate | Last |
|---|---|---|---|---|
| 2/13 | 8:30 AM | Jan Sep CPI m/m | 0.3 | 0.3 |
| 2/13 | 8:30 AM | Jan Sep Core CPI m/m | 0.3 | 0.2 |
| 2/13 | 8:30 AM | Jan Sep CPI y/y | 2.5 | 2.7 |
| 2/13 | 8:30 AM | Jan Sep Core CPI y/y | 2.5 | 2.6 |
| 2/17 | 10:00 AM | Feb Oct Homebuilder Sentiment | n/a | 37 |
| 2/18 | 8:30 AM | Dec P Sep P Durable Gds Orders | -1.7 | 5.3 |
| 2/18 | 2:00 PM | Jan 28 Sep 17 FOMC Minutes | n/a | 0 |
| 2/18 | 4:00 PM | Dec Aug Net TIC Flows | n/a | 212.036 |
| 2/19 | 8:30 AM | Dec Aug Trade Balance | -55.5 | -56.825 |