The S&P 500 fell 2% this week, with 10 out of the 11 sectors down. The worst performance came out of the materials and consumer-staples sector, which were down 7.2% and 4.9%, respectively. Naturally, the energy sector benefited from worries about dragged out conflict pushing up oil prices. It was the lone gainer this week, up 1%.
Prices for Brent crude, the international oil benchmark, rose 27% this week to $92.69 a barrel. It last traded at those prices in September 2023. Disruptions in the Strait of Hormuz, which connects the Persian Gulf to global markets, have come into focus, especially because about 20% of the world’s oil passes through it.
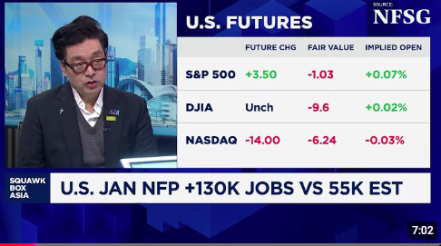
Higher oil prices are worrying because they could stoke inflation, complicating it for the Federal Reserve to lower interest rates. A small silver lining on that came Friday when the U.S. nonfarm payrolls report showed that the economy lost 92,000 jobs last month, coming in below expectations of a 50,000 increase. While that’s a sign that the labor market is struggling, it also makes the case for the Fed to look to easing monetary policy.
Fundstrat Head of Research Tom Lee said that March will most likely be an up month for the stock market and recommends investors buy the dip in the Magnificent Seven, software stocks, and crypto, especially because he believes that those assets have mostly bottomed.
“I don’t know when to say we’re gonna be reaching our low related to the Iran war, but we know markets bottom on bad news,” he said. “It’s better to leg into the low rather than try to time the bottom.”
Head of Technical Strategy Mark Newton agrees with Lee for the most part, except on the Magnificent Seven. While he recommends shifting into software stocks, he is not so sure yet about the Magnificent Seven.
“This is really not an area where you want to step in and buy. You really need to see improvement,” he said during the weekly huddle. Since the Magnificent Seven stocks are about 30% of the broader market, Newton expects the market will continue to be choppy until they steady out.
One positive feature of the market right now, according to Newton, is that the breadth is still holding up in pretty robust fashion. And until that gives way, he is not too concerned.
“We are down from January levels, but if you look at both percentage of stocks within 20% of 12-month highs or percentage of stocks above their 200-day moving average, or any of the gauges of just advanced decline, things are still holding up in pretty good fashion, not only with S&P 500 but also in the Russell 3000,” he said.
And to put the stock market’s performance this week into perspective, the S&P 500 is off a mere 3.4% from its all-time highs.
Chart of the Week
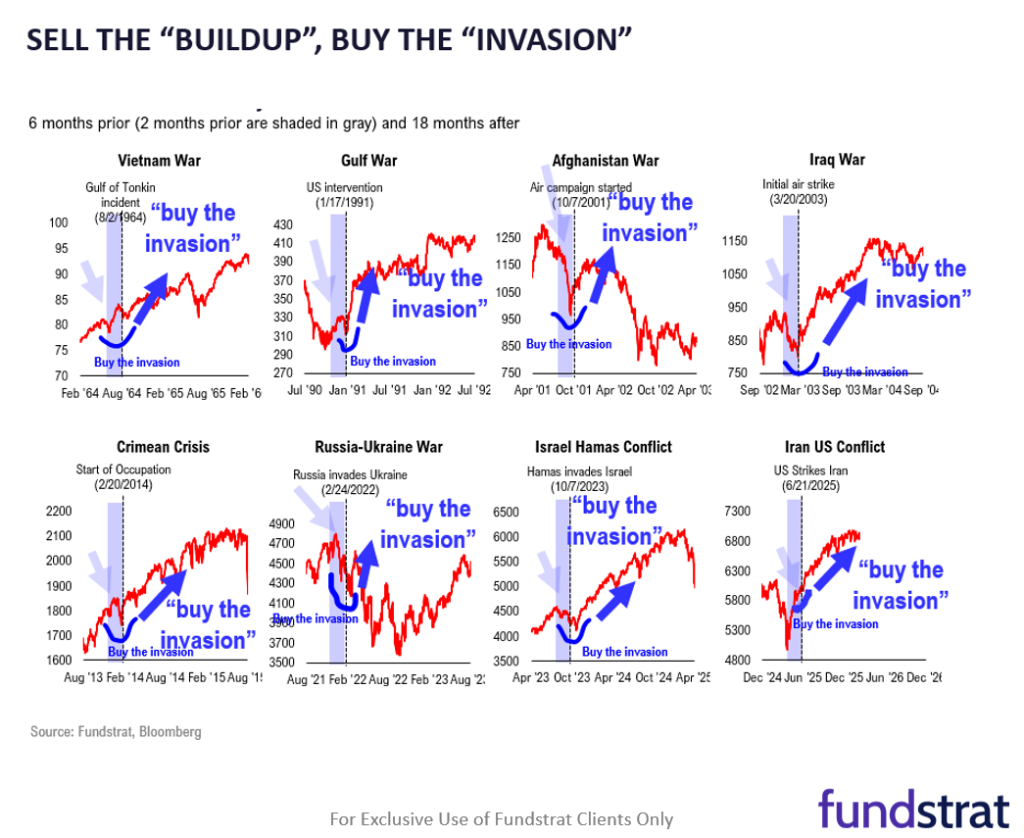
During heightened geopolitical tensions, Fundstrat Head of Research Tom Lee reminded investors about the old market adage of “sell the buildup, buy the invasion.” In his Macro Minute videos this week, he said that adage has held up in seven of the last eight conflicts, as our Chart of the Week shows. He believes the jolt to the markets will be short term. One reason for that is because the VIX spiked on a spot basis compared to a week ago, but “the future months have barely moved so the market is viewing it as a short-term spike.”
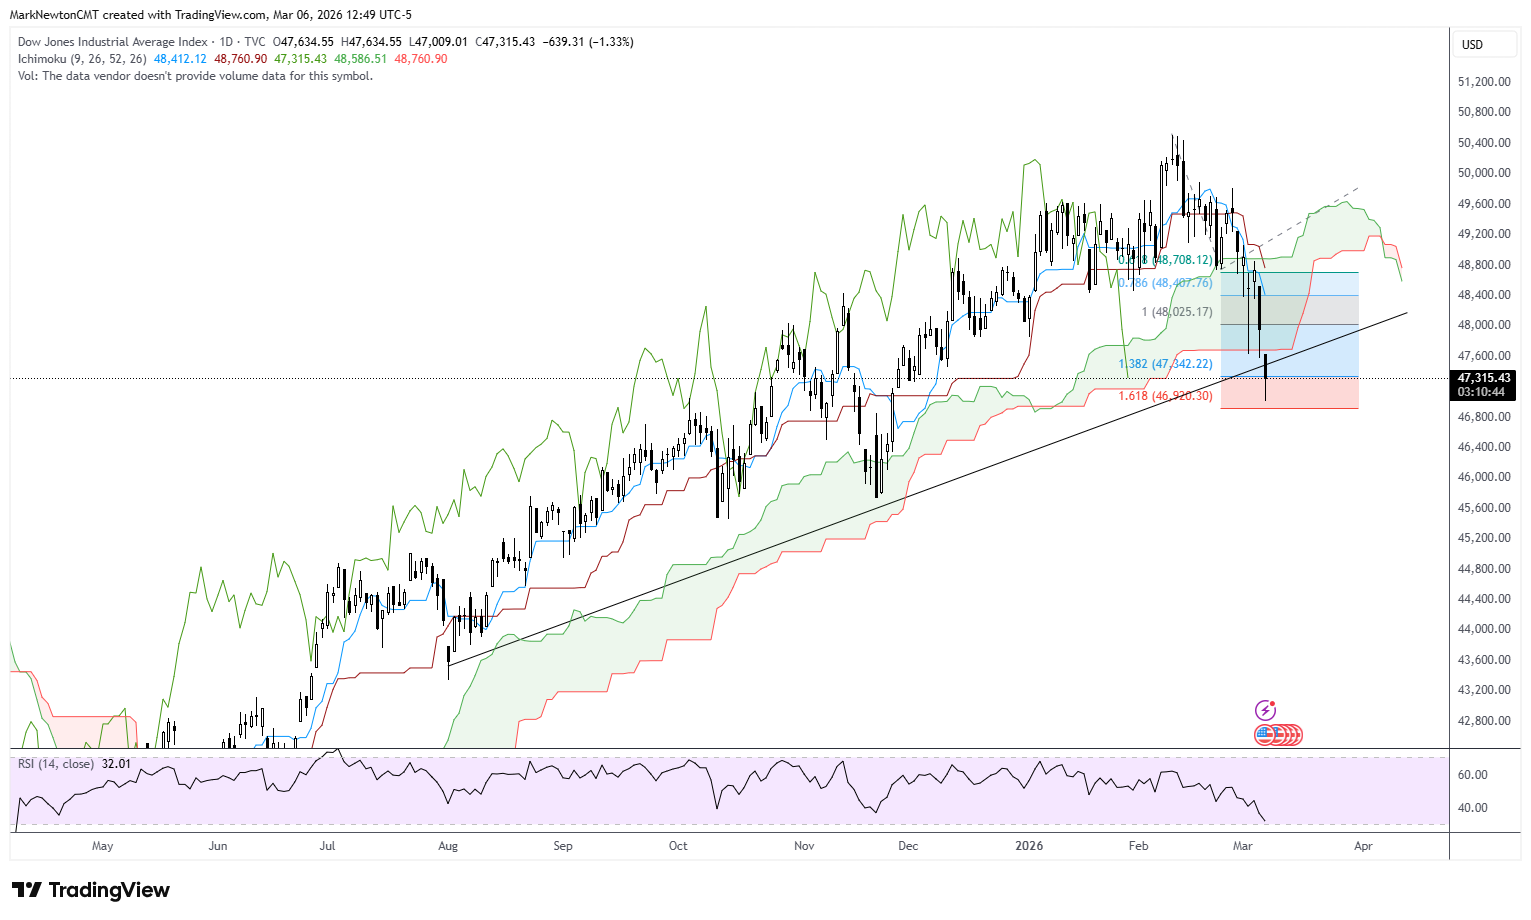
Just past mid-day, we’ve seen a minor bounce attempt from earlier lows, and both DJIA and the Equal-weighted SPX have pulled back into support and have attempted to rally. While ^SPX remains lower by -1.3% and breadth is down at 4/1 negative, QQQ has not broken down out of its consolidation and ^SPX remains above Tuesday’s lows and lies near Ichimoku Cloud support. Thus, while the market feels like it’s continuing lower today, there really hasn’t been much of a breakdown and there is some cyclical support which is possible to see today into early next week which might result in a reversal. I don’t think we can rule out a late day rally not dissimilar from recent days towards the close and any hint of news of Hormuz strait being stabilized would likely result in an about-face for Equities higher and WTI Crude to turn down. Overall, this looks like an interesting spot for Equities to stabilize specifically given RSP, DJIA and SPX charts, while QQQ has not broken down. The next couple days of trading will help to confirm this and/or late day strength today
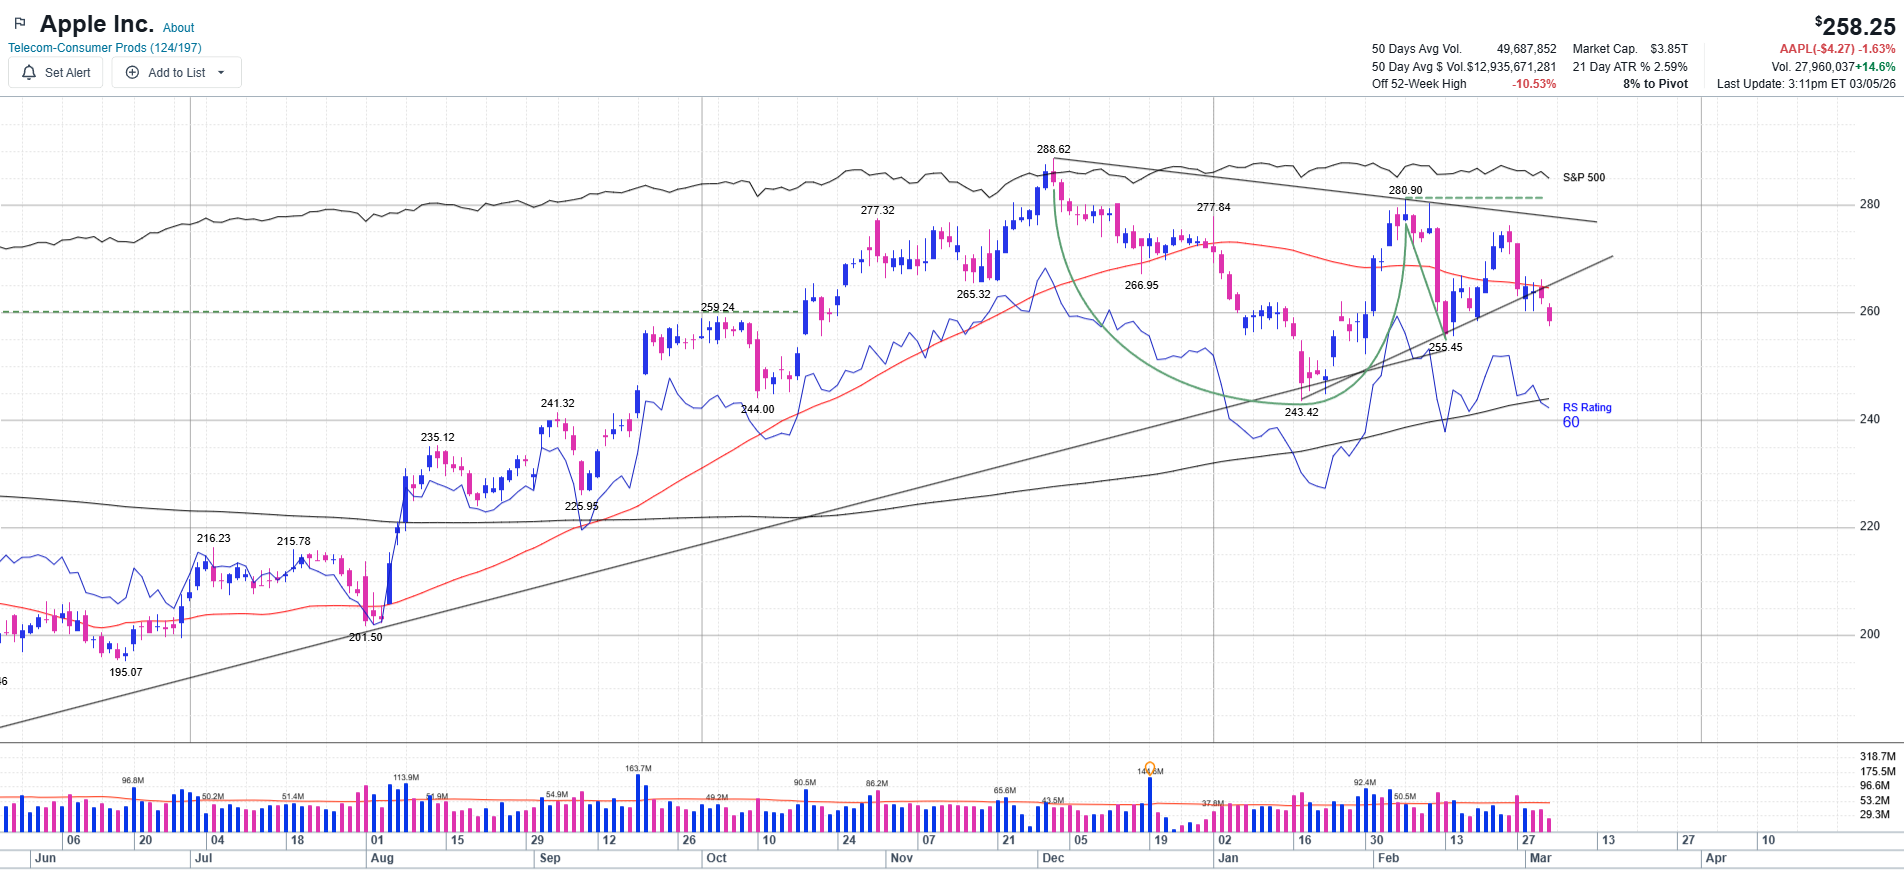
One specific issue for the market today is the breakdown in AAPL -1.09% which had been holding up in recent days. This triangle break given AAPL’s 7% weight is causing more pressure than normal on US Equity indices and the move under 261.42 has violated this triangle to the downside. It will be important to hold the area at 255-256.60 next near February lows. Any break of 255 could possibly coincide with a test of 243 but this is a stock which will need to stabilize and start to turn higher quickly for SPX to be able to stabilize.
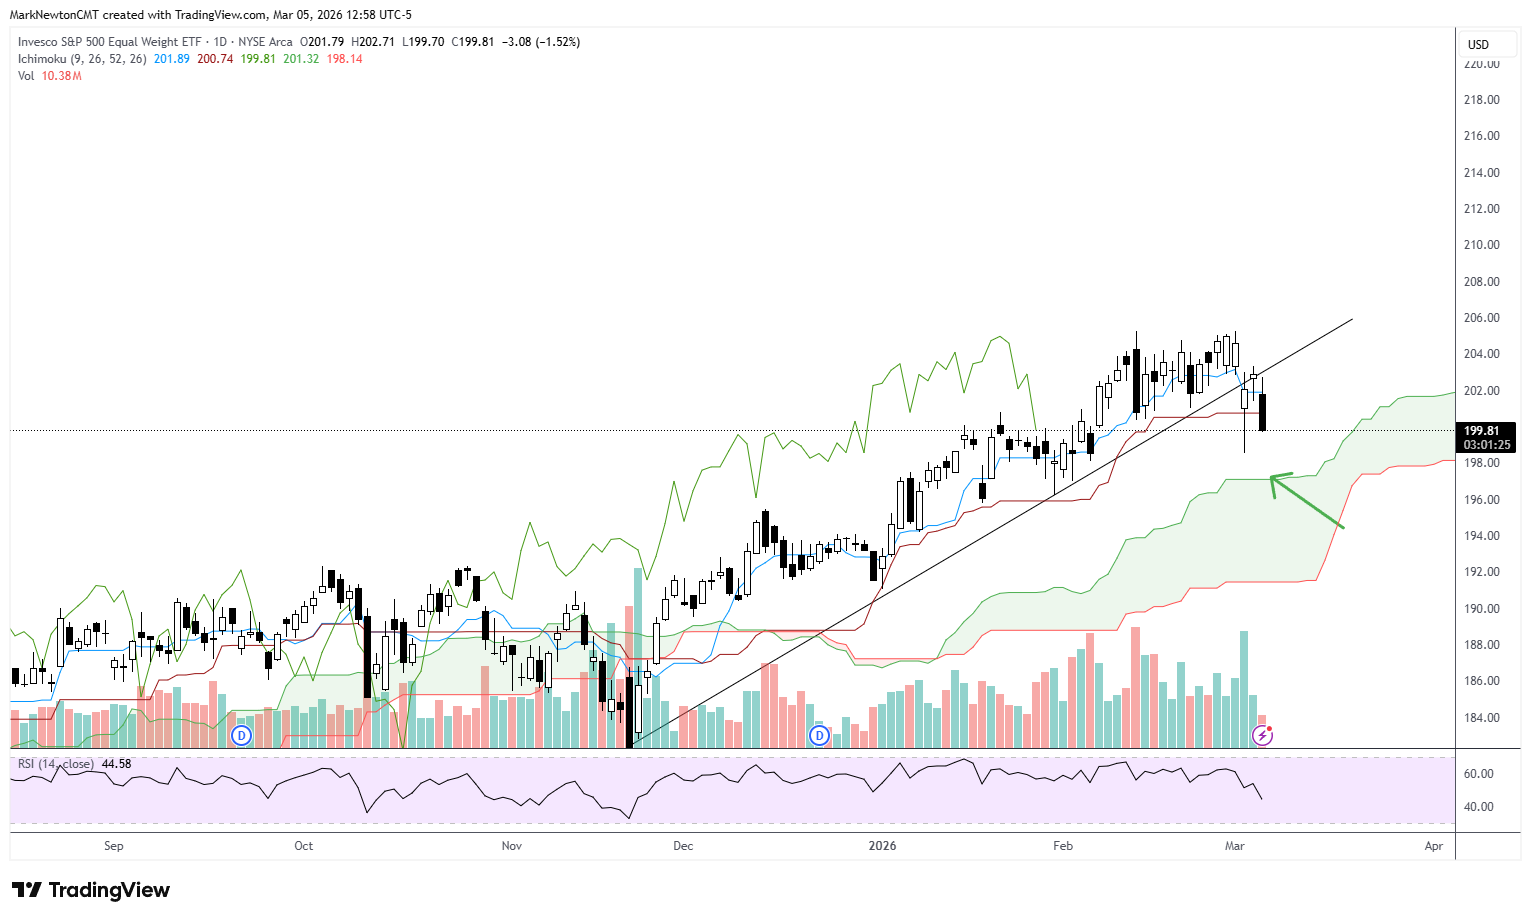
Equal-weighted S&P 500 ETF (RSP -1.19% ) failed to regain its trend on the bounce yesterday which SPX and QQQ both did, and now has pulled back to near the lows of today’s session, lower by -1.50%. I expect that Equal-weighted SPX should find strong support at 197 into either Friday or Monday-Tuesday of next week and would be an idea area to buy dips, for those looking. this represents strong Ichimoku Cloud support. However, the bigger message is that Trends for RSP -1.19% which had been intact since November were broken and not recaptured this past Tuesday and now are showing the potential of a bit more weakness into early next week.
This research is for the clients of Fundstrat Direct only. Fundstrat Direct Subscription entitles the subscriber to 1 user, research cannot be shared or redistributed. For additional information, please contact your sales representative or Fundstrat Direct at fundstratdirect.com.
Conflicts of Interest
This research contains the views, opinions and recommendations of Fundstrat Direct. At the time of publication of this report, Fundstrat Direct does not know of, or have reason to know of any material conflicts of interest.
General Disclosures
Fundstrat Direct is an independent research company and is not a registered investment advisor and is not acting as a broker dealer under any federal or state securities laws.
Fundstrat Direct is a member of IRC Securities’ Research Prime Services Platform. IRC Securities is a FINRA registered broker-dealer that is focused on supporting the independent research industry. Certain personnel of Fundstrat Direct (i.e. Research Analysts) are registered representatives of IRC Securities, a FINRA member firm registered as a broker-dealer with the Securities and Exchange Commission and certain state securities regulators. As registered representatives and independent contractors of IRC Securities, such personnel may receive commissions paid to or shared with IRC Securities for transactions placed by Fundstrat Direct clients directly with IRC Securities or with securities firms that may share commissions with IRC Securities in accordance with applicable SEC and FINRA requirements. IRC Securities does not distribute the research of Fundstrat Direct, which is available to select institutional clients that have engaged Fundstrat Direct.
As registered representatives of IRC Securities our analysts must follow IRC Securities’ Written Supervisory Procedures. Notable compliance policies include (1) prohibition of insider trading or the facilitation thereof, (2) maintaining client confidentiality, (3) archival of electronic communications, and (4) appropriate use of electronic communications, amongst other compliance related policies.
Fundstrat Direct does not have the same conflicts that traditional sell-side research organizations have because Fundstrat Direct (1) does not conduct any investment banking activities, and (2) does not manage any investment funds.
This communication is issued by Fundstrat Direct and/or affiliates of Fundstrat Direct. This is not a personal recommendation, nor an offer to buy or sell nor a solicitation to buy or sell any securities, investment products or other financial instruments or services. This material is distributed for general informational and educational purposes only and is not intended to constitute legal, tax, accounting or investment advice.
The statements in this document shall not be considered as an objective or independent explanation of the matters. Please note that this document (a) has not been prepared in accordance with legal requirements designed to promote the independence of investment research, and (b) is not subject to any prohibition on dealing ahead of the dissemination or publication of investment research.
Intended for recipient only and not for further distribution without the consent of Fundstrat Direct.
This research is for the clients of Fundstrat Direct only. Additional information is available upon request. Information has been obtained from sources believed to be reliable, but Fundstrat Direct does not warrant its completeness or accuracy except with respect to any disclosures relative to Fundstrat Direct and the analyst’s involvement (if any) with any of the subject companies of the research. All pricing is as of the market close for the securities discussed, unless otherwise stated. Opinions and estimates constitute our judgment as of the date of this material and are subject to change without notice. Past performance is not indicative of future results. This material is not intended as an offer or solicitation for the purchase or sale of any financial instrument. The opinions and recommendations herein do not take into account individual client circumstances, risk tolerance, objectives, or needs and are not intended as recommendations of particular securities, financial instruments or strategies. The recipient of this report must make its own independent decision regarding any securities or financial instruments mentioned herein. Except in circumstances where Fundstrat Direct expressly agrees otherwise in writing, Fundstrat Direct is not acting as a municipal advisor and the opinions or views contained herein are not intended to be, and do not constitute, advice, including within the meaning of Section 15B of the Securities Exchange Act of 1934. All research reports are disseminated and available to all clients simultaneously through electronic publication to our internal client website, fundstratdirect.com. Not all research content is redistributed to our clients or made available to third-party aggregators or the media. Please contact your sales representative if you would like to receive any of our research publications.