It’s been quite a week, but the S&P 500 closed last week up 3.56%. This despite investors having begun the week confronting threats by President Trump that ‘a whole civilization [would] die” by Tuesday evening. Whether it’s in spite of that or because of it, what we have for now is a tentative ceasefire that seems to have given all of us a bit more hope that a peaceful resolution might be on the horizon.
For investors who have been asking, “Is the bottom in?” Fundstrat Head of Research Tom Lee sees a strong likelihood that it is. He actually saw signs of that from last week, when equities deviated from their traditional relationship with oil prices.
As you might know, there is an inverse correlation between equities and oil prices: equities tend to fall when oil prices rise (and vice versa.) That’s mostly held true during the latest Iran conflict and the subsequent surge in oil. Yet at the end of March, this changed: In Lee’s view, the fact that “a continued rise in oil wasn’t causing equities to fall further” (both rose at the same time) suggested that stocks had bottomed on the weeks of bad news. A second signal further supports Lee’s view. We discuss that in our Chart of the Week below.
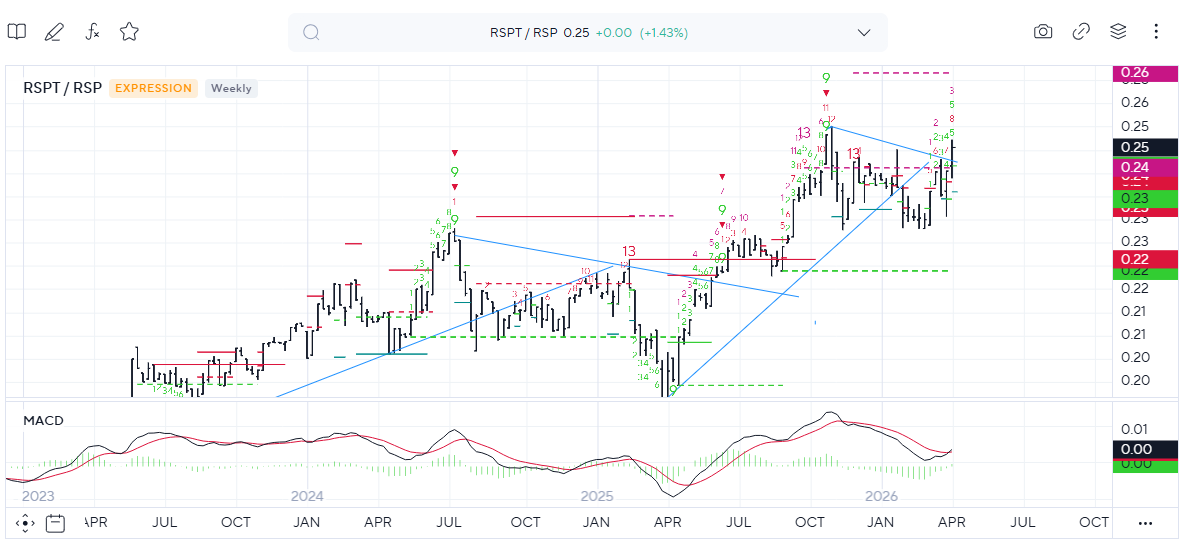
As for Head of Technical Strategy Mark Newton, he’s inclined to agree, for different reasons. Last week saw technology breaking out relative to equal-weighted S&P 500 (RSPT 0.58% vs. RSP -0.46% ), signaling a possible period of outperformance for technology. “This is quite bullish for U.S. stocks,” Newton told us, and strictly based on technical analysis, “I am expecting SPX to push back to new all-time highs in the months to come.”
Sector Allocation Strategy
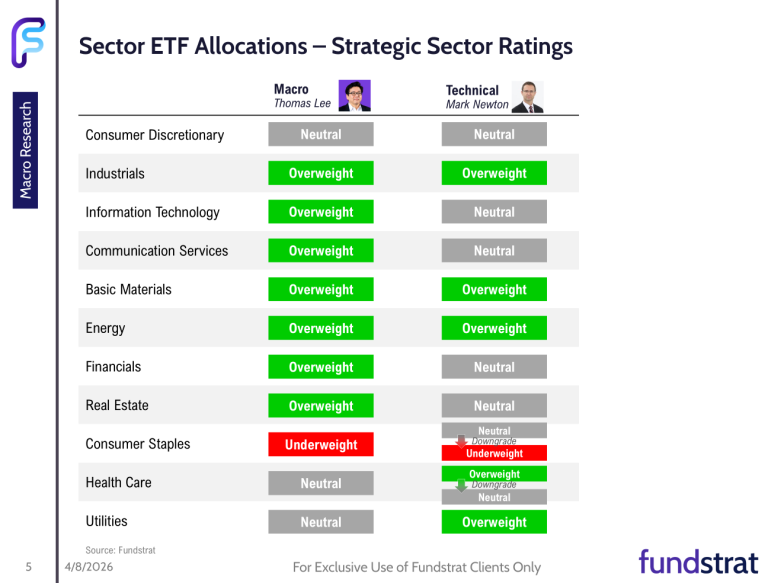
These are the latest strategic sector ratings from Head of Research Tom Lee and Head of Technical Strategy Mark Newton – part of the April 2026 update to the Fundstrat Sector Allocation Strategy. Macro and Pro subscribers can click here for ETF recommendations, precise guidance on strategic and tactical weightings, detailed commentary, and methodology.
Chart of the Week
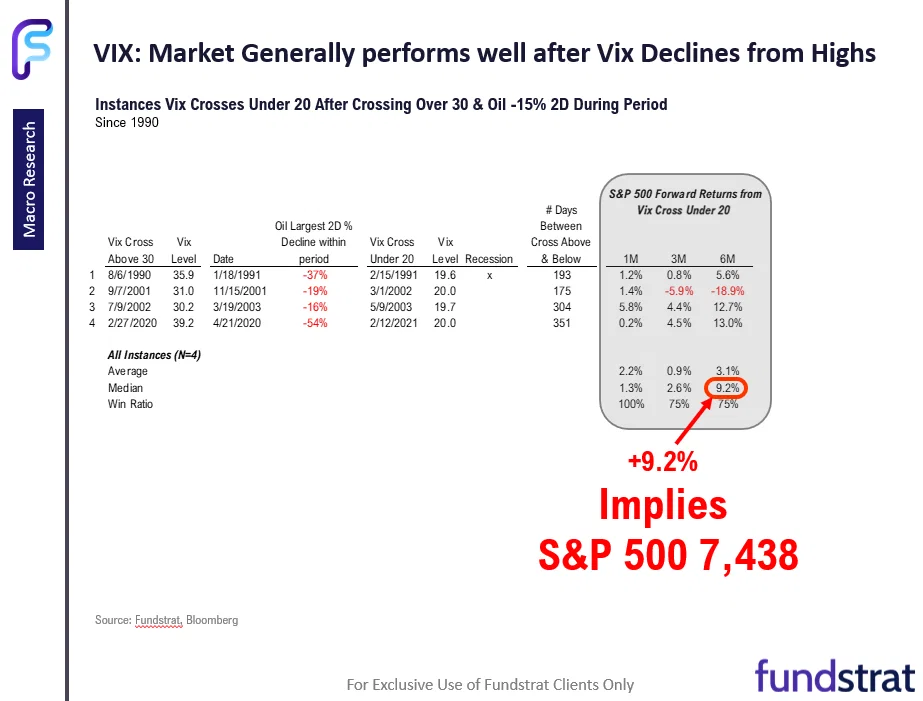
The VIX, which showed volatility rising as high as 28 on Tuesday, closed below 20 on Thursday. To Lee, this is a sign that investors’ attempts to seek risk protection have peaked. As is often the case, Lee and his team looked to historical precedent for clues about what might lie ahead. They found that since 1990, there have been four instances that are similar to our current scenario: a VIX close above 30 (as it did on March 27 and March 30), followed by a decline to below 20 and a concurrent a fall in oil prices of 15% or more. The median forward gains one month, three months, and six months later were 1.3%, 2.6%, and 9.2%, respectively. As our Chart of the Week, the median six-month forward gain implies the possibility of S&P 500 reaching 7,438 in October.
In my view the White House needs an exit strategy from the President’s harsh rhetoric of the past few days and the Pakistani cease fire proposal may be the right idea at the right time. The offer includes a provision that Iran opens the Strait of Hormuz during the two-week cease fire. Iran says it is positively looking at the proposal, and the White House has said the President has seen it and will respond. In my view most positive development in several days.
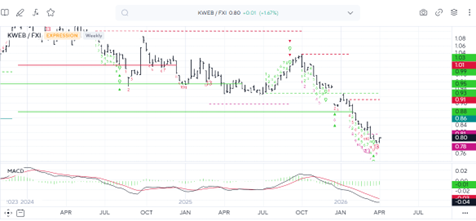
KWEB looks preferable to FXI as a way to play Chinese Equities recovering. Interestingly enough, but not surprising given its Tech exposure, DeMark-based exhaustion signals are now showing counter-trend exhaustion “13 Countdown” signals (“Buys” ) on the ratio of KWEB -0.31% vs. FXI 0.06% for the first time since last Fall’s decline got underway. (KraneShares CSI China Internet ETF – KWEB -0.31% ) vs. the Ishares China Large-cap ETF (FXI 0.06% ) which should lead to a period of snapback recovery and mean reversion in the Tech-heavy KWEB which has underperformed FXI since last Fall. Thus, KWEB looks like the better choice than FXI for those trying to play a recovery for China on a falling US Dollar. This weekly Symbolik chart shows this ratio of KWEB to FXI along with two different DeMark-based buy signals
This might be the most important chart for the US Stock market as it shows Technology breaking back out vs. Equal-weighted S&P in ratio form (RSPT -0.73% vs. RSP -0.72% ) and should coincide with Growth beginning to turn back higher vs. Value and lead to Technology beginning a period of outperformance. This is quite bullish for US stocks and i expect that an eventual strengthening in the “Magnificent 7” would be the catalyst that could lead US higher again vs. the All-country World index. For now, this weekly ratio chart shows Tech vs. SPX having exceeded a minor resistance trendline which argues for more Tech outperformance.
This research is for the clients of Fundstrat Direct only. Fundstrat Direct Subscription entitles the subscriber to 1 user, research cannot be shared or redistributed. For additional information, please contact your sales representative or Fundstrat Direct at fundstratdirect.com.
Conflicts of Interest
This research contains the views, opinions and recommendations of Fundstrat Direct. At the time of publication of this report, Fundstrat Direct does not know of, or have reason to know of any material conflicts of interest.
General Disclosures
Fundstrat Direct is an independent research company and is not a registered investment advisor and is not acting as a broker dealer under any federal or state securities laws.
Fundstrat Direct is a member of IRC Securities’ Research Prime Services Platform. IRC Securities is a FINRA registered broker-dealer that is focused on supporting the independent research industry. Certain personnel of Fundstrat Direct (i.e. Research Analysts) are registered representatives of IRC Securities, a FINRA member firm registered as a broker-dealer with the Securities and Exchange Commission and certain state securities regulators. As registered representatives and independent contractors of IRC Securities, such personnel may receive commissions paid to or shared with IRC Securities for transactions placed by Fundstrat Direct clients directly with IRC Securities or with securities firms that may share commissions with IRC Securities in accordance with applicable SEC and FINRA requirements. IRC Securities does not distribute the research of Fundstrat Direct, which is available to select institutional clients that have engaged Fundstrat Direct.
As registered representatives of IRC Securities our analysts must follow IRC Securities’ Written Supervisory Procedures. Notable compliance policies include (1) prohibition of insider trading or the facilitation thereof, (2) maintaining client confidentiality, (3) archival of electronic communications, and (4) appropriate use of electronic communications, amongst other compliance related policies.
Fundstrat Direct does not have the same conflicts that traditional sell-side research organizations have because Fundstrat Direct (1) does not conduct any investment banking activities, and (2) does not manage any investment funds.
This communication is issued by Fundstrat Direct and/or affiliates of Fundstrat Direct. This is not a personal recommendation, nor an offer to buy or sell nor a solicitation to buy or sell any securities, investment products or other financial instruments or services. This material is distributed for general informational and educational purposes only and is not intended to constitute legal, tax, accounting or investment advice.
The statements in this document shall not be considered as an objective or independent explanation of the matters. Please note that this document (a) has not been prepared in accordance with legal requirements designed to promote the independence of investment research, and (b) is not subject to any prohibition on dealing ahead of the dissemination or publication of investment research.
Intended for recipient only and not for further distribution without the consent of Fundstrat Direct.
This research is for the clients of Fundstrat Direct only. Additional information is available upon request. Information has been obtained from sources believed to be reliable, but Fundstrat Direct does not warrant its completeness or accuracy except with respect to any disclosures relative to Fundstrat Direct and the analyst’s involvement (if any) with any of the subject companies of the research. All pricing is as of the market close for the securities discussed, unless otherwise stated. Opinions and estimates constitute our judgment as of the date of this material and are subject to change without notice. Past performance is not indicative of future results. This material is not intended as an offer or solicitation for the purchase or sale of any financial instrument. The opinions and recommendations herein do not take into account individual client circumstances, risk tolerance, objectives, or needs and are not intended as recommendations of particular securities, financial instruments or strategies. The recipient of this report must make its own independent decision regarding any securities or financial instruments mentioned herein. Except in circumstances where Fundstrat Direct expressly agrees otherwise in writing, Fundstrat Direct is not acting as a municipal advisor and the opinions or views contained herein are not intended to be, and do not constitute, advice, including within the meaning of Section 15B of the Securities Exchange Act of 1934. All research reports are disseminated and available to all clients simultaneously through electronic publication to our internal client website, fundstratdirect.com. Not all research content is redistributed to our clients or made available to third-party aggregators or the media. Please contact your sales representative if you would like to receive any of our research publications.