Last week, stocks built on the surge from the week before to continue their ascent, though to a lesser extent. This rise took place amidst continued war-related uncertainty. As Fundstrat’s Washington Policy Strategist Tom Block noted, the war in Iran continues to feature “mixed messages from Tehran and DC,” and “neither side appears to have an exit strategy.”
That’s an assessment with which Head of Research Tom Lee agrees. “We’re still in the fog of war,” he remarked. Oil prices have traditionally displayed an inverse correlation with stocks, so the fact that stocks have managed to climb with the price of crude remaining elevated has arguably been evidence of what Head of Technical Strategy Mark Newton described as “extraordinary resiliency.”
Newton added, “The market’s a lot healthier now than it was two months ago. Technically, I think that’s very good.” In particular, he pointed out that Russell 3000 breadth has risen to new all-time highs. “That’s quite encouraging, since that’s essentially 95% of tradable stocks,” he pointed out.
Yet looking further out, Lee reiterated to subscribers during Fundstrat’s monthly Macro Update and Top Ideas webinar last that although he continues to expect a fourth-quarter rally, “we think there’s going to be what feels like a bear market in the middle of the year.” Why? The Federal Reserve getting a new leader could be a large part of it, in Lee’s view.
President Trump’s nominee to head the Federal Reserve, Kevin Warsh, testified before the Senate Banking Committee this week as part of the confirmation process. Lee told us that “taken in total, [Warsh’s testimony] would suggest we have a Fed that would operate very differently under Warsh compared to Powell,” assuming of course that Warsh is confirmed as many currently expect. It would be understandable for the market to require an adjustment period.
Chart of the Week
In the view of Fundstrat Head of Research Tom Lee, “if oil drops, assets with the highest [historical] inverse correlation to oil should go up a lot.” As our Chart of the Week shows, the assets with the highest inverse correlation to oil over the past five years have been the S&P 500, Ethereum, and the Magnificent Seven. This is notable because Head of Technical Strategy Mark Newton sees a drop in crude prices as a distinct possibility, with recent price movements suggesting what he described as “a pretty negative pattern.”
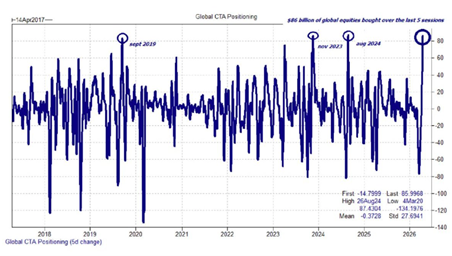
Chart from Goldman Sachs shows the Commodity Trading Advisor (CTA) positioning since 2017. CTA’s bought more than $86 billion in global equities over the past five trading sessions which has amounted to one of the biggest buying sprees on record. According to Goldman, “previous episodes of accelerated demand have seen short-term consolidation, followed by medium term strength, with S&P up an average of +8.2% three months later”
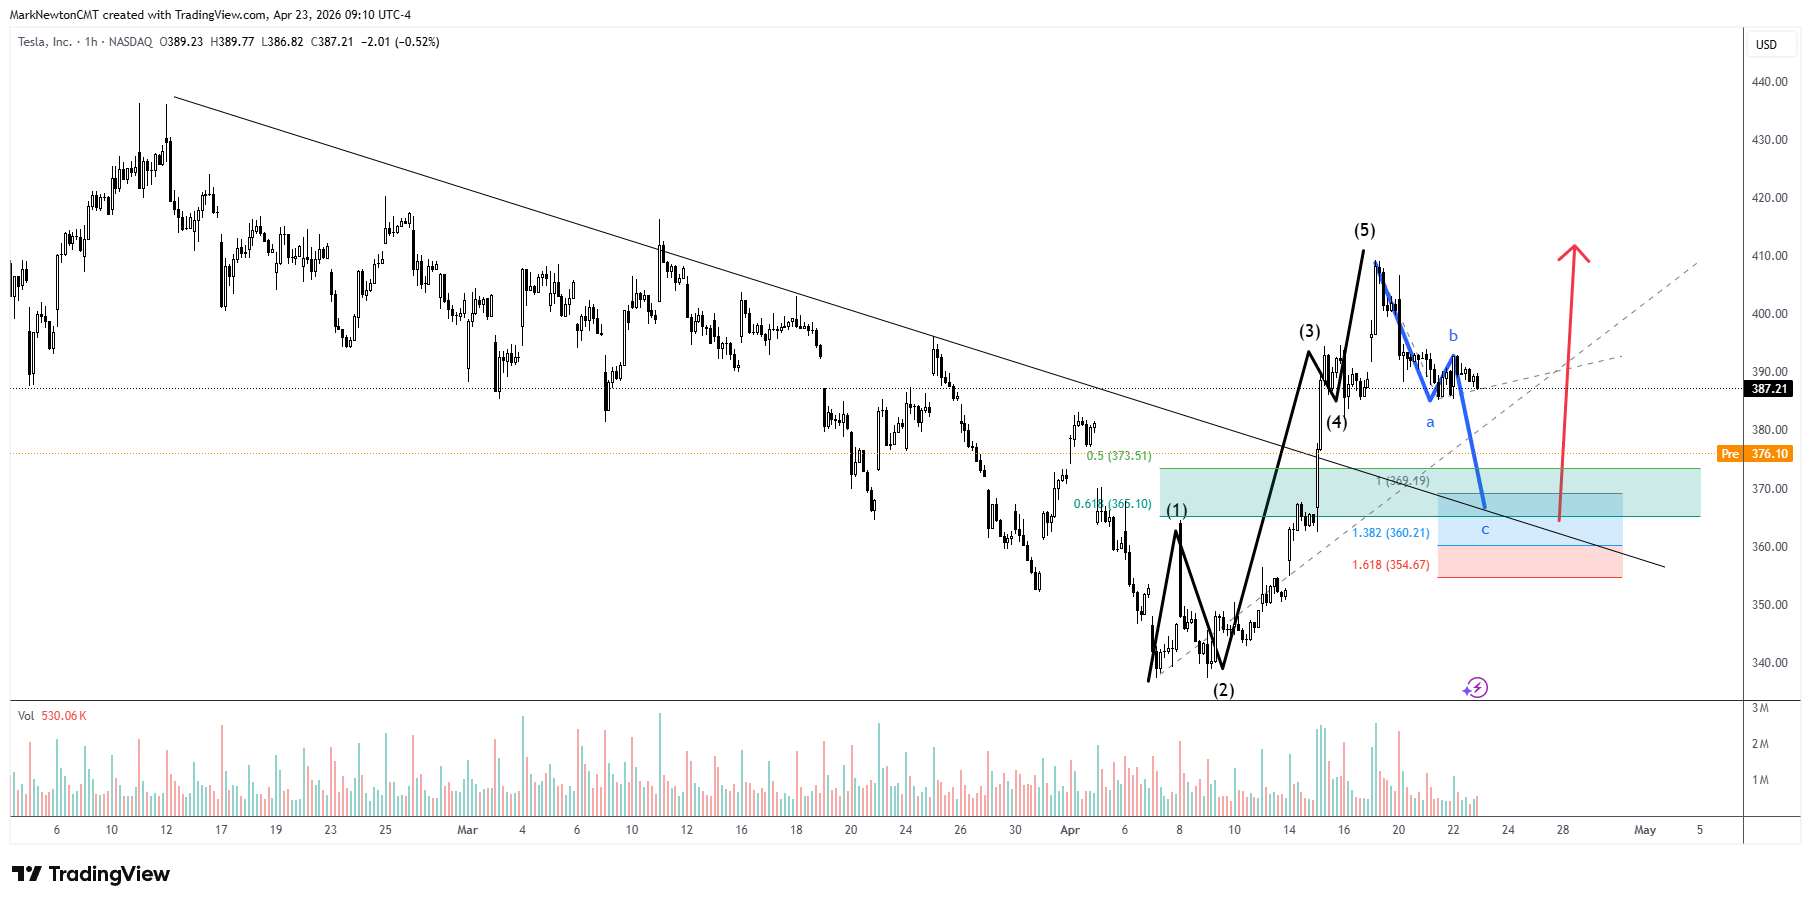
Lots of questions about TSLA 0.65% today as the stock completely reversed its post-market gains and currently is lower by ~3.50% following yesterday’s earnings and details regarding their Capital expenditures being boosted to more than $25 billion in the next year. While this certainly is a long-term positive, many worry about the near-term, and the stock has fallen in trading today as a result. Technically speaking, i am less inclined to see this decline as being bearish, as the stock pushed up aggressively to break the intermediate-term downtrend from December 2025 into early April. As shown below, TSLA has now given back a bit over 50% of our rally from early April but yet momentum is in better shape. When measuring the projections both based on the first wave of the decline and extrapolating along with just basic Fibonacci levels, it appears that $360-$370 has a number of various technical targets. While normally gaps like we’ve seen today rarely can mark absolute lows, it should make TSLA a very good risk/reward now as cycles start to turn back aggressively higher for TSLA into June. Overall, i like owning TSLA here despite what feels like a failed period of follow-through post Earnings as momentum and technical structure is both better than it was last month, and the stock should stabilize in the next 1-2 weeks and begin pushing higher. Above $393 would be the first bullish sign and over $409 should lead up to $470.
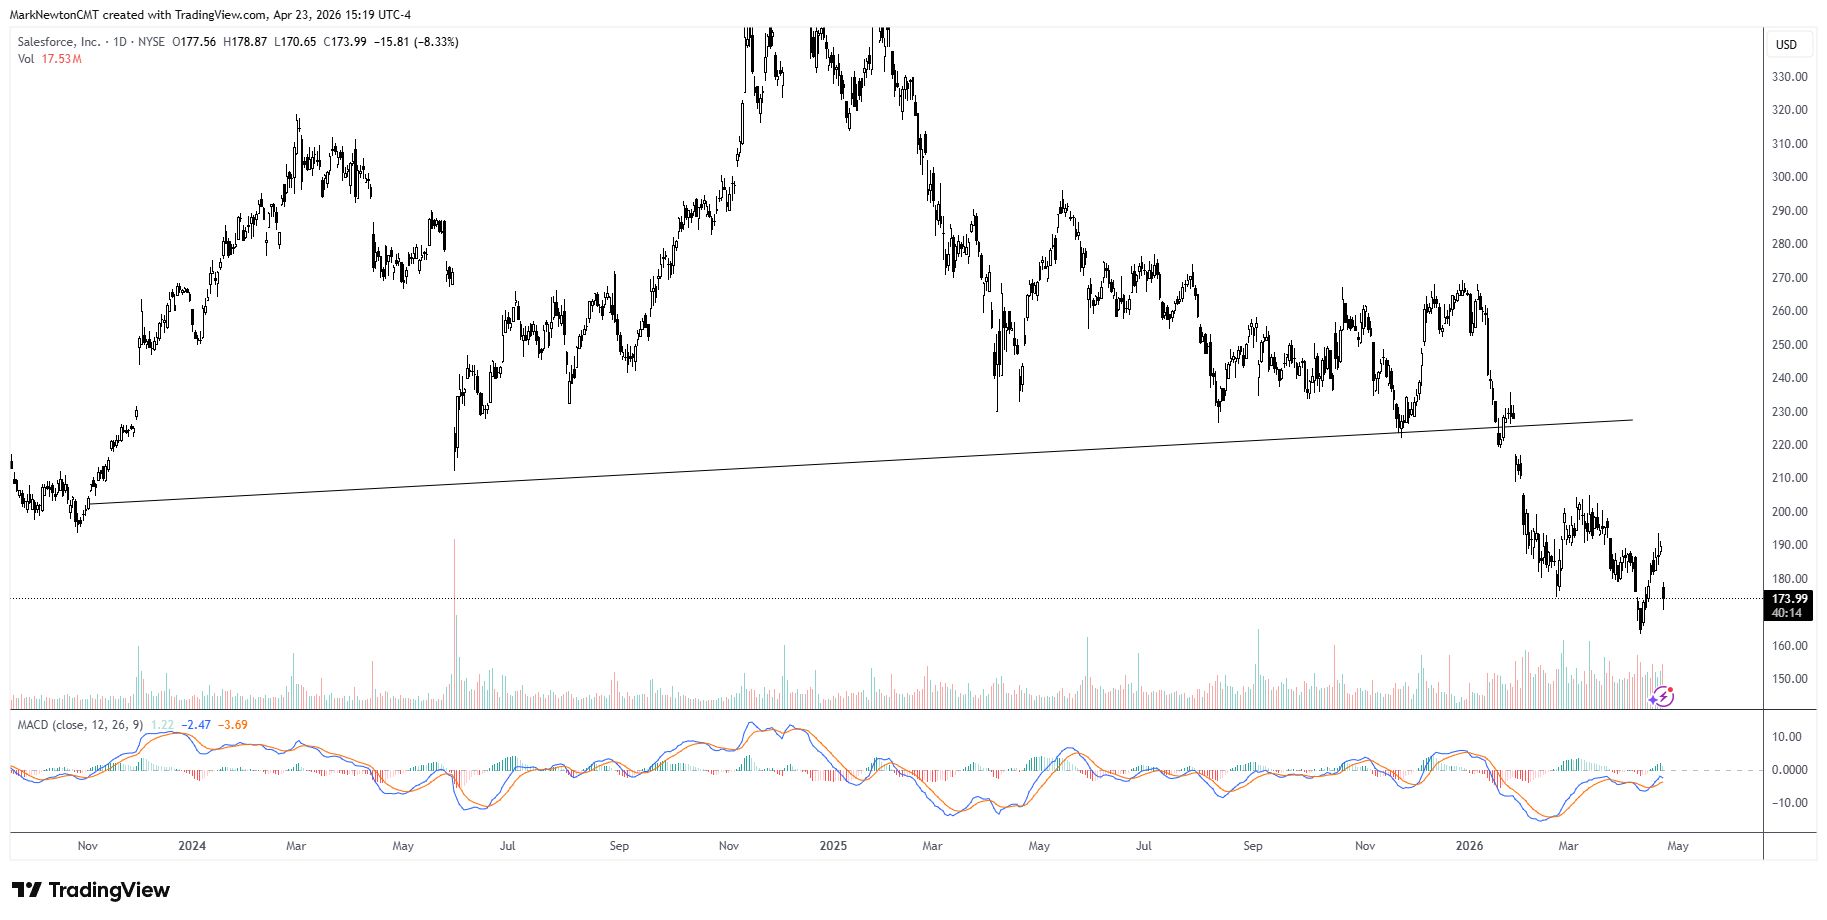
Software giant Salesforce.com has been under continued pressure since the breakdown from its multi-year Head and Shoulders pattern. While many feel this stock is undervalued, CRM 2.86% charts still show a declining technical trend from last Fall and certainly one which will take some time to repair. Movement above $193.50 would be meaningful in the short run for CRM Bulls while regaining its larger support trend (now upside resistance near $225, is important for the larger pattern towards getting more constructive.
This research is for the clients of Fundstrat Direct only. Fundstrat Direct Subscription entitles the subscriber to 1 user, research cannot be shared or redistributed. For additional information, please contact your sales representative or Fundstrat Direct at fundstratdirect.com.
Conflicts of Interest
This research contains the views, opinions and recommendations of Fundstrat Direct. At the time of publication of this report, Fundstrat Direct does not know of, or have reason to know of any material conflicts of interest.
General Disclosures
Fundstrat Direct is an independent research company and is not a registered investment advisor and is not acting as a broker dealer under any federal or state securities laws.
Fundstrat Direct is a member of IRC Securities’ Research Prime Services Platform. IRC Securities is a FINRA registered broker-dealer that is focused on supporting the independent research industry. Certain personnel of Fundstrat Direct (i.e. Research Analysts) are registered representatives of IRC Securities, a FINRA member firm registered as a broker-dealer with the Securities and Exchange Commission and certain state securities regulators. As registered representatives and independent contractors of IRC Securities, such personnel may receive commissions paid to or shared with IRC Securities for transactions placed by Fundstrat Direct clients directly with IRC Securities or with securities firms that may share commissions with IRC Securities in accordance with applicable SEC and FINRA requirements. IRC Securities does not distribute the research of Fundstrat Direct, which is available to select institutional clients that have engaged Fundstrat Direct.
As registered representatives of IRC Securities our analysts must follow IRC Securities’ Written Supervisory Procedures. Notable compliance policies include (1) prohibition of insider trading or the facilitation thereof, (2) maintaining client confidentiality, (3) archival of electronic communications, and (4) appropriate use of electronic communications, amongst other compliance related policies.
Fundstrat Direct does not have the same conflicts that traditional sell-side research organizations have because Fundstrat Direct (1) does not conduct any investment banking activities, and (2) does not manage any investment funds.
This communication is issued by Fundstrat Direct and/or affiliates of Fundstrat Direct. This is not a personal recommendation, nor an offer to buy or sell nor a solicitation to buy or sell any securities, investment products or other financial instruments or services. This material is distributed for general informational and educational purposes only and is not intended to constitute legal, tax, accounting or investment advice.
The statements in this document shall not be considered as an objective or independent explanation of the matters. Please note that this document (a) has not been prepared in accordance with legal requirements designed to promote the independence of investment research, and (b) is not subject to any prohibition on dealing ahead of the dissemination or publication of investment research.
Intended for recipient only and not for further distribution without the consent of Fundstrat Direct.
This research is for the clients of Fundstrat Direct only. Additional information is available upon request. Information has been obtained from sources believed to be reliable, but Fundstrat Direct does not warrant its completeness or accuracy except with respect to any disclosures relative to Fundstrat Direct and the analyst’s involvement (if any) with any of the subject companies of the research. All pricing is as of the market close for the securities discussed, unless otherwise stated. Opinions and estimates constitute our judgment as of the date of this material and are subject to change without notice. Past performance is not indicative of future results. This material is not intended as an offer or solicitation for the purchase or sale of any financial instrument. The opinions and recommendations herein do not take into account individual client circumstances, risk tolerance, objectives, or needs and are not intended as recommendations of particular securities, financial instruments or strategies. The recipient of this report must make its own independent decision regarding any securities or financial instruments mentioned herein. Except in circumstances where Fundstrat Direct expressly agrees otherwise in writing, Fundstrat Direct is not acting as a municipal advisor and the opinions or views contained herein are not intended to be, and do not constitute, advice, including within the meaning of Section 15B of the Securities Exchange Act of 1934. All research reports are disseminated and available to all clients simultaneously through electronic publication to our internal client website, fundstratdirect.com. Not all research content is redistributed to our clients or made available to third-party aggregators or the media. Please contact your sales representative if you would like to receive any of our research publications.