



US Equity indices’ ability to carve out a positive week doesn’t take away some of the short-term negatives that remain in place. It’s thought that the next couple weeks have the potential to be volatile before a low and larger bounce gets underway in September
Friday’s bounce looked to be something to play for given the possibility of hourly oversold conditions following Thursday’s decline along with the recent wave structure of the move in Treasuries. SPX bounced right from near the first support target mentioned last night near 4363.
However, it’s tough just yet thinking the short-term low discussed over the past week is in, and the subsequent bounce in September has definitively gotten underway. A few of the following issued merit further discussion and analysis:
- Wave structure in S&P’s bounce from Thursday’s lows was not particularly constructive
- DeMark exhaustion is not yet in place on TYX monthly, and not ideal on TNX, TYX weekly, not to mention TLT monthly Symbolik charts which call for a retest of lows.
- Breadth nor momentum deteriorated sufficiently as of yet to match March 2023 lows
- Seasonality remains difficult in September
- Short-term Elliott-wave patterns still make the case for a break of 8/18 lows in SPX
- 80-day trading day cycle argues for bottom the first week of September, not 8/18
- Short-term technical structure is not positive enough to argue for upside continuation
- Momentum (per MACD) is negatively sloped on daily, weekly charts and not oversold
- No evidence of capitulation on this drawdown from late July by means of excessive downside volume or fear having reached levels that normally point to an oversold bottom
Overall, I’ll respect strength when I see it. It was right to be positive heading into Friday’s Jackson Hole speech. However, to expect that a lack of selling Friday means that markets are completely “out of the woods” is a bit premature. Bottom line, I do feel that a low is approaching that should lead to a much larger rally. I just can’t say with conviction that it’s in place.
While I’ve listed a few negatives, there are certainly positives also to discuss. These center on some of the following:
- Sentiment has retreated sharply in the last couple weeks from bullish levels from late July. This should provide a cushion on Equity weakness into early September
- Technology, Industrials, and Discretionary have all held up in good fashion, despite recent market consolidation. Uptrends relative to SPX remain intact
- Monthly MACD remains positive on SPX
- Intermediate-term peaks on US Dollar and on Treasury yields are near, despite a possible push back to new highs in yield into early September
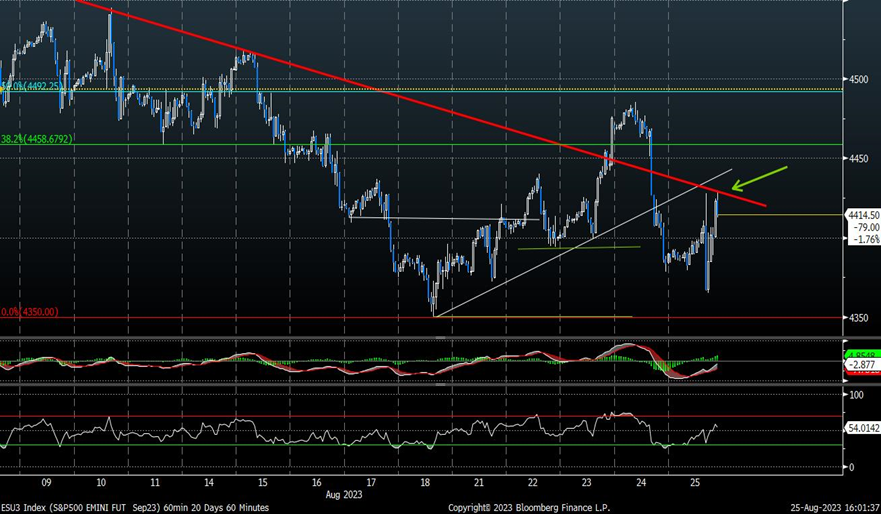
As this hourly chart shows below, the pullback on Thursday proved to give back much further than what is considered healthy, technically speaking. While a bounce happened post Powell’s Jackson Hole speech, price advanced to a poor short-term risk/reward spot, in my view. This lines up near the ongoing downtrend connecting former late July/early August peaks and represents a 61.8% Fibonacci retracement of the high to low range from Thursday into Friday. Finally, this area lies near the downside pivot break of Thursday’s decline. (As the technical saying goes, “Former support often becomes resistance on a retest”)
SPX Support- 4380, 4335, 4300; Resistance 4420, 4471
QQQ Support- 355, 349; Resistance 367, 374-5
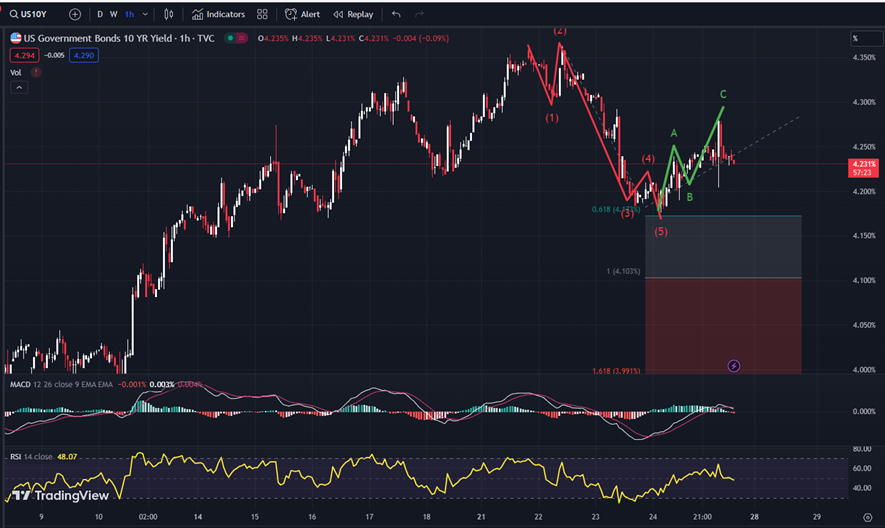
Treasury yields might weaken to 4.10-4.15% in TNX, before pushing back to minor new highs
The shape of this TNX decline into Thursday’s lows for TNX was one reason why it looked right to be positive into Friday’s Jackson hole Speech. Even if counter-trend three-wave bounces occurred on Friday (which looked to have occurred) the broader pattern suggests a possible decline down to 4.10-4.15. This has the potential to be temporarily supportive to the Equity market.
However, the lack of sufficient DeMark exhaustion on weekly and monthly charts of TLT, TNX, TYX is troubling. IN my view, this means an eventual retest of highs to generate a stronger “Sell exhaustion” in yields is forthcoming. (This also plays into the idea that an immediate peak and yields and huge pullback might prove difficult without some backing and filling)
Overall, I am bearish for yields between this Fall and next Summer along with the US Dollar for weakness. However, this might take time. One still cannot rule out a push back to new monthly highs in yields which might prove unsettling for the equity market.
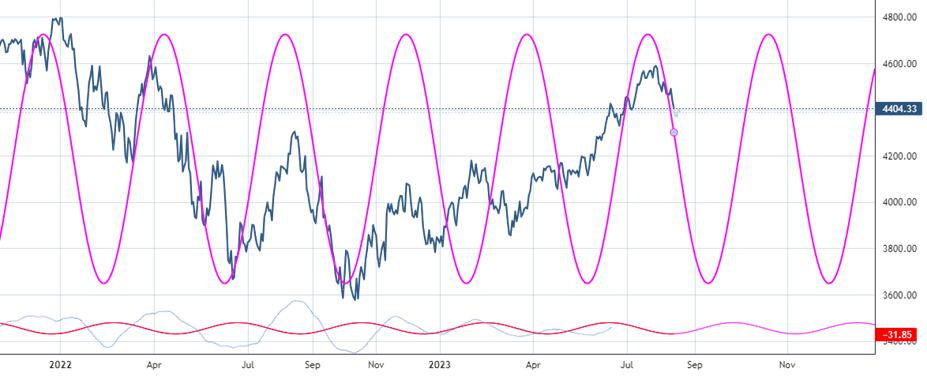
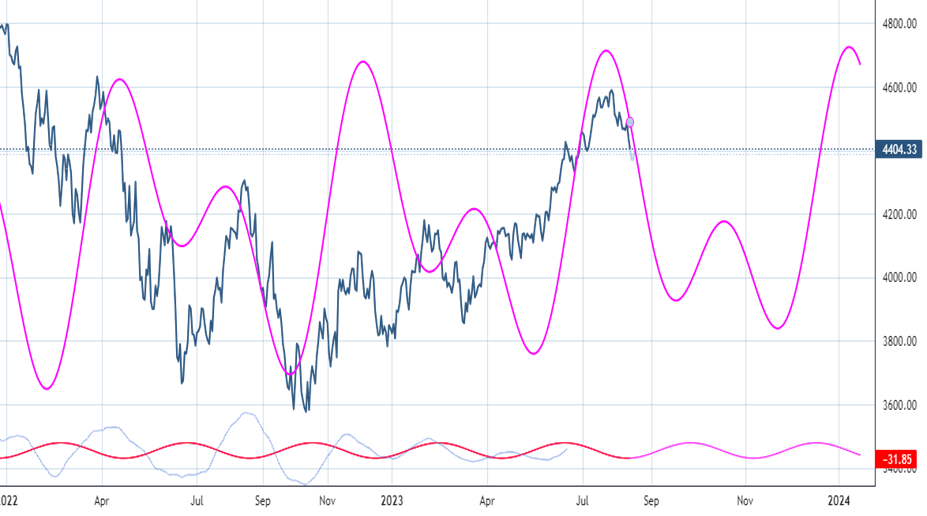
SPX 80-day cycle peaked on time; Will it next bottom on time in early September?
SPX 80 day cycle bottoms in early September after having peaked in late July.
(The pink line shown in this cycle composite is amplitude, not magnitude. Thus, a revisiting of lows is not necessary and weakness from late July into August has occurred on schedule.)
Important to watch this carefully and not “jump the gun” on thinking markets have already bottomed given its record of success over the last couple years.
This bottoms in September, then peaks out in October ahead of a decline into mid-November which could arrive mid-month. The last part of the year is expected to be bullish, which goes along with traditional positive seasonality in December. I’ll monitor as these time periods grow closer.
SPX cycle composite shows a choppy period from September into November before bottoming and pushing back to new highs
SPX composite has several important daily cycles, and not just the 80-day cycle. This also bottoms in September and rallies but then shows further possible weakness between October and November.
Overall, I’m not certain that this composite is definitely the correct way to view the next few months. However, it certainly gels with the negative slope in weekly momentum given weakness three out of the last four weeks.
The key takeaway when looking at the cycle for the next 2-3 months is that additional “choppiness” is certainly not something to rule out, until/unless more proof about a larger decline in Treasury yields is apparent.
While a larger trading low is due within the next 1-2 weeks, I’m uncertain and skeptical that this leads back to highs right away. It appears like a choppy period lies ahead.
Overall, the weekly, intermediate-term cycle for SPX remains positioned for higher prices in the back half of 2023. So, it will be important to balance this choppiness seen on daily cycle composites with the bullish directional bent of the intermediate-term view.
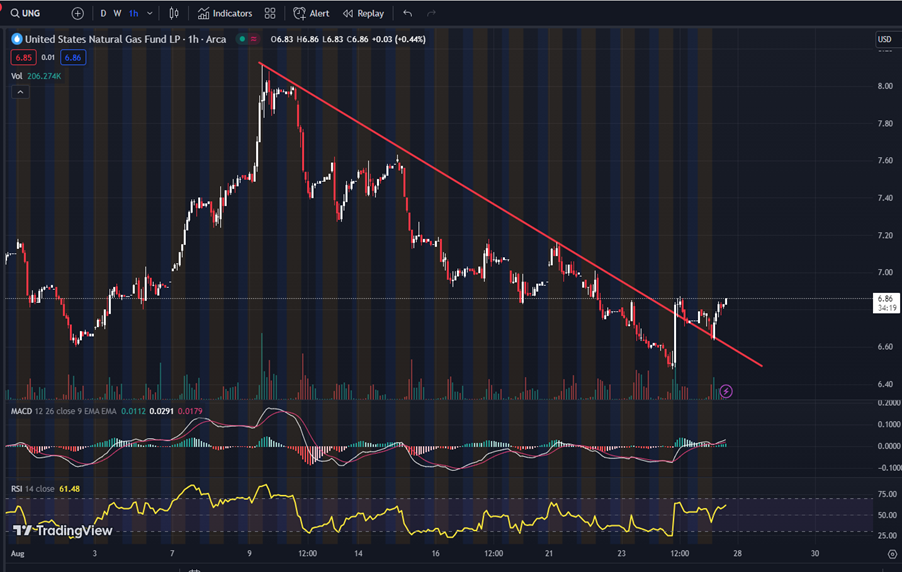
Natural Gas starting to turn higher. Bullish for a near-term rise to $2.80 in NG and to $7.30-$7.50 in UNG
The downturn in Natural Gas in August looks complete as of the last couple days. Gains look to be getting underway.
I don’t suspect that gains necessarily break August highs; However, at least a 50-62% rally of this former decline looks likely.
UNG looks attractive given the sharp reversal late this week and evidence of near-term stabilization.
A rally above $6.86 looks likely which should spur on gains up to at least $7.30 for UNG. Downside risk levels lie at $6.64