



Note: As part of our transition from FS Insight to Fundstrat Direct, my daily notes will transition from mark.newton@fsinsight.com to mark.newton@fundstratdirect.com. Please add the new address to your contacts or safe sender list to ensure uninterrupted delivery. The research and insights you rely on will remain exactly the same — only our name and sender address are changing. If you have questions, please visit our FAQ here.

The short-term breakdown for most US Equity indices over the last couple of trading days leaves near-term trends negative, but arguably still part of larger neutral consolidation patterns since last fall. The extraordinary surge in WTI & Brent Crude oil has coincided with above-average volatility across many asset classes, which remains difficult to reverse right away, given the escalation in geopolitical tension. The US Dollar and TNX look to be up near resistance, but the prospects for the US Dollar reversal look a bit stronger than thinking TNX will immediately pull back to recent lows. With regards to Equities, some stabilization is required and looks to be trying to happen today. However, the next step is the most critical in examining the pattern of any bounce and keeping a close eye on market breadth. My expectation last week was that some stabilization might happen early this week, and this looks to be happening on schedule. However, it’s unclear at this point if this can be strong enough to rule out additional selling pressure into March expiration (which is a strong area for time-based support) The “Bullish Engulfing” patterns in SPX, RSP, IWM along with bearish reversal patterns on Crude, and TNX are constructive, but more will need to happen to expect the worst is behind us given no real indications of sentiment-driven capitulation.
While 10, & 30-Year Treasury yields, along with the US Dollar, look to be nearing resistance, all eyes continue to be on Crude oil and wondering what can be done to slow the pace of the recent rally.
In the short run, Monday’s reversal in ^SPX, DJIA from off early lows, and DXY, ^TNX, and Crude futures from early highs looks constructive and might be able to kick off a multi-day bounce. “Bullish Engulfing” patterns, technically speaking, are normally positive towards thinking the decline should be nearing a temporary low. However, it’s hard to make the case for a push back to new highs after recent damage, and it’s wise to be patient and study the pattern of any bounce along with the corresponding market breadth before getting too bullish in trying to buy dips.
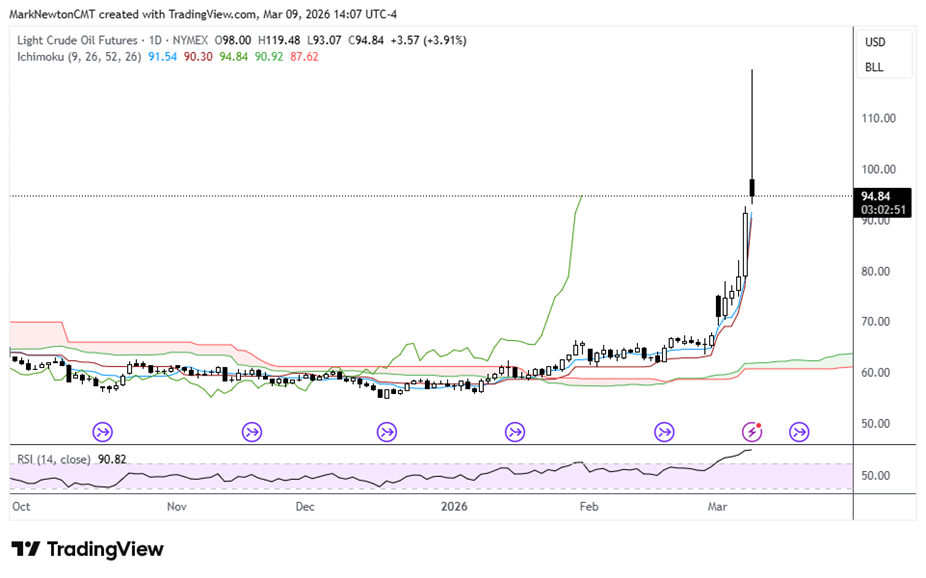
Following Monday’s session, while a possible near-term peak looks close for Crude, it’s still hard to make the case for a meaningful top given the momentum of the last week.
As seen below, the reversal in WTI Crude oil is one of the more important factors that could help risk assets stabilize. Monday’s reversal looks like a temporary positive. However, dips back down to 80-90 should find initial support and allow for another rally to get underway.
Light Crude Oil Futures
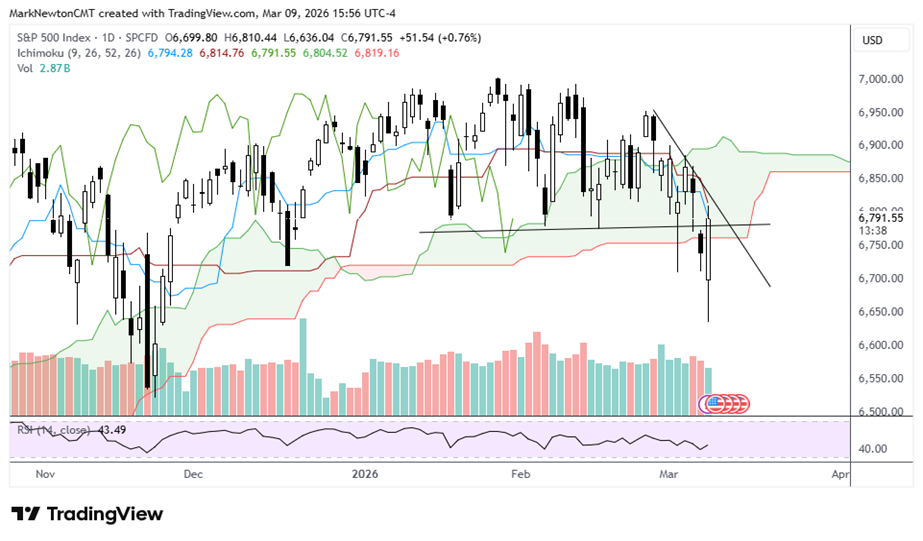
SPX reversal is a positive, but a rally back to highs right away could prove to be a difficult short-term hurdle, barring a Crude collapse
The last couple of days have seen ^SPX break down to join the near-term bearishness of DJIA and RSP. However, QQQ remains largely churning in range-bound consolidation after its first drop and could still face weakness over the next couple of weeks after its own bounce attempt.
Monday’s reversal was a definite positive for the near-term for ^SPX, as the bullish engulfing pattern likely could show further follow-through higher for ^SPX and ^TNX. Crude Oil also showed reversals in trading.
The key for the near-term is to bring about stabilization in Technology along with Financials, and help the spike in WTI Crude to reverse sharply along with ^TNX on signs of stabilization in the Middle East.
This might sound like an impossible task in the short run, but the key will be for stocks like AAPL, NVDA, along with many in the Semiconductor space, to turn back up sharply in the days and weeks to come.
Furthermore, it’s important to see market breadth begin to expand in a way that has marked the downdraft lately in terms of negative breadth, which now needs to be reversed. (In other words, there’s been heavy downside negative breadth over the past five trading days, and now it’s important to see the opposite.)
A lackluster rally with no real participation would be troubling for the prospects of prices pushing higher immediately above 6900, and given no high TRIN readings, it’s important to see some evidence of the US Equity market holding.
In the event of a bounce that then fails and turns back lower to undercut Monday’s lows, my sights would turn to November lows near 6521 for a possible short-term target.
S&P 500 Index
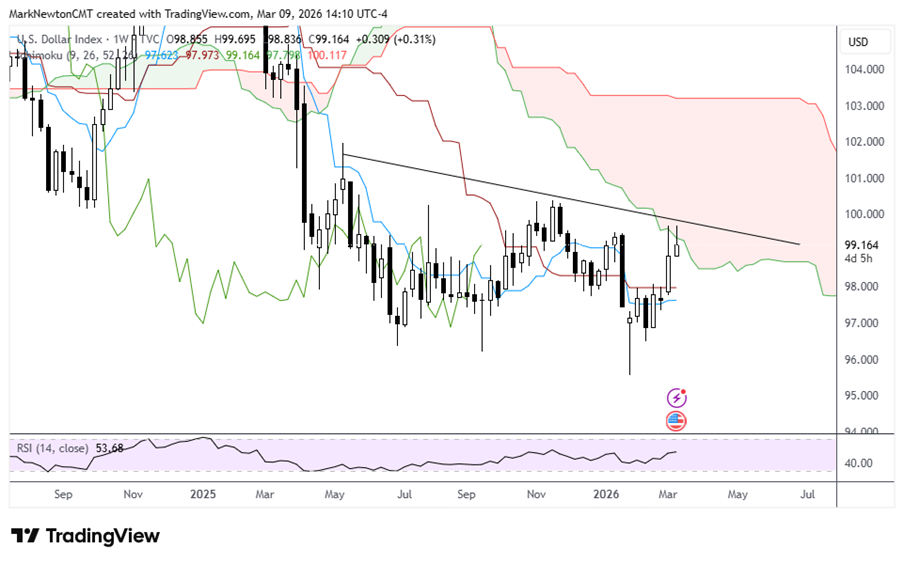
US Dollar index looks close to a peak
The Dollar experienced a meaningful “reflationary” bounce following the Iran attack, which has happened in the past during 2009, 2020, and 2025, but ultimately proved short-lived.
I don’t expect much more strength out of the US Dollar near-term, and technicals call for DXY to peak in about a week from both a price and time standpoint.
I expect a push back to new lows, and DXY very well might undercut 95 over the next couple of months.
Furthermore, USD/JPY should also be close to peaking, and I anticipate a coming Yen rally back to 147-149.
As can be seen below, DXY has a massive weekly Ichimoku Cloud directly overhead, which I anticipate will be quite difficult to break in the near-term.
At present, upside should prove limited and should constitute an opportunity to accumulate long positions in Japanese Yen.
U.S. Dollar Index
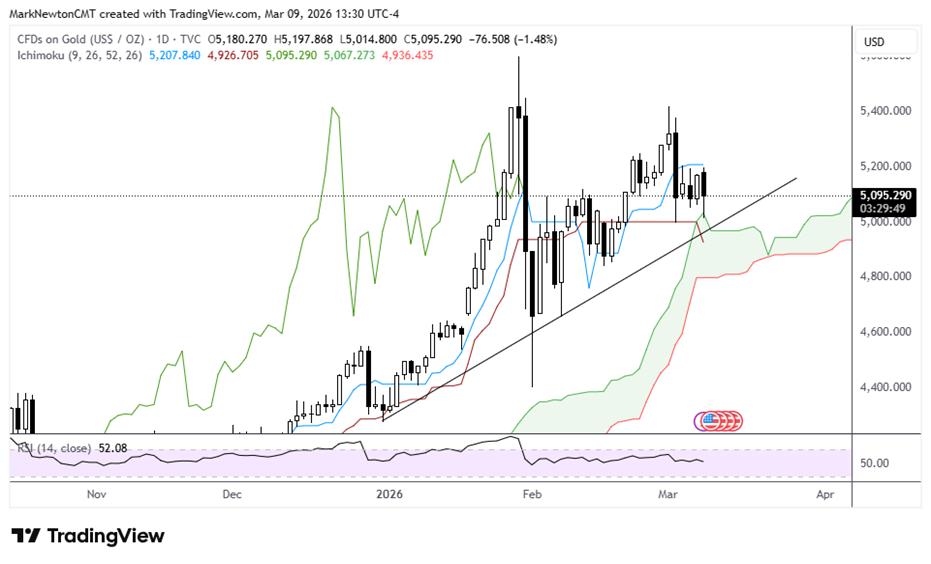
Gold and Silver look to be down near support and should begin to rally
Technically, the recent decline in precious metals looks overdone, and I expect that both Gold and Silver should start to bounce back to highs in the weeks to come.
I had expected a strong selloff post 2/27, but the extent of the decline thus far in both Gold and Silver has proven innocuous and not all that important, technically.
While Central bank purchases of Gold have slowed recently, along with flow data having shown notable outflows, I’m still betting on an above-average rebound in the Metals before thinking a decline into late Spring/Summer has begun (which gels with some shorter-term cycles for Gold and Silver).
While it will be important to keep a close tab on momentum as it has begun to slow lately, the technical structure still looks to be in good shape and supports the idea of Gold turning back higher.
I like being long Gold here, thinking upside can occur back to new all-time highs.
The technical risk would involve 5000 being undercut, which would temporarily cause a selloff to 4795.
Gold metal and mining stocks also look attractive and I suspect that these will stabilize and also start to push higher. GDX might be something to consider for investors who have an interest in this regard.
Bottom line, Gold looks like a much better risk/reward than a few weeks ago, and the weekly and monthly momentum remain quite bullish. Any move back above 5400 in Gold could reach 6600-6800, which would be a stronger area of upside resistance.
CFDs on Gold (US$ / OZ)