


Note: As part of our transition from FS Insight to Fundstrat Direct, my daily notes will transition from mark.newton@fsinsight.com to mark.newton@fundstratdirect.com. Please add the new address to your contacts or safe sender list to ensure uninterrupted delivery. The research and insights you rely on will remain exactly the same — only our name and sender address are changing. If you have questions, please visit our FAQ here.

Near-term SPX trends remain bearish, and trends and momentum remain negatively sloped while market breadth is in dire need of immediate recovery. For now, the risk-on trade remains captive to WTI Crude oil and progress in reopening the Hormuz Strait. In the short run, Wednesday’s breakout in WTI Crude back higher likely can result in a push back to $115, and the breakout in global bond yields might prove more troublesome to Equities in the short run. Until evidence of capitulation arises, it’s likely that US Equity indices are setting up for a coming test of last November 2025 lows. It’s thought that U.S. equities require a lot of strength and breadth improvement to expect that a further selloff into April can be avoided, and for now, volume hasn’t been strong enough into Declining issues to think that any evidence of capitulation is at hand. Most investors should continue to favor a heavily diversified stance and overweight defensive sectors like Utilities, Telecom, and Pharmaceutical stocks until Technology can show more evidence of stabilization.
US Equity indices closed at the lowest levels of the year as ^SPX got to within striking distance of November 2025 lows, while QQQ violated its month-long consolidation before attempting a late-day rally.
While the volatility in US risk assets has recently proven less extreme than Europe and/or Asia in the last week with regards to Equities, Fixed income and (WTI Crude compared to Brent Crude) I don’t sense this means that any sort of meaningful bottom is forming for US Equities.
Trends remain bearish for Equities, given a general deterioration in breadth, technical structure, and momentum, and there hasn’t been sufficient evidence of capitulation. While a minor stabilization to close mildly higher than Thursday’s opening “print” is a small positive, I don’t expect that markets rally too much off these lows before November lows are tested for both ^SPX and QQQ.
For now, it’s right to be defensive, as trends are bearish and until there is evidence of Crude backing down along with US Treasury yields, and the US Dollar, it should pay to be very diversified and not “take big bets”.
Evidence of a break in the downtrend on above-average breadth would be the first real instance of a rally attempt getting started, but for now, this remains quite premature.
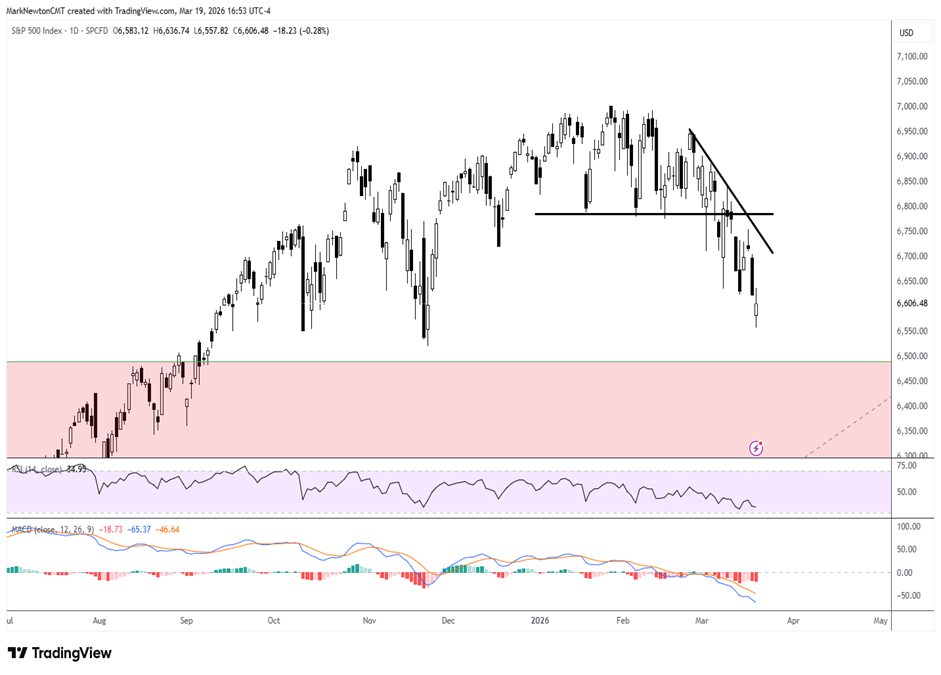
As shown below, trends remain negative and have gotten worse in recent days, while momentum is negatively sloped and there’s no evidence of any counter-trend exhaustion, nor capitulation.
S&P 500 Index
Technology has been a big outperformer over the last week, despite markets selling off sharply
Sector-wise, the last week has proven interesting as Technology has outperformed all but one of the major sectors in the rolling five-day period.
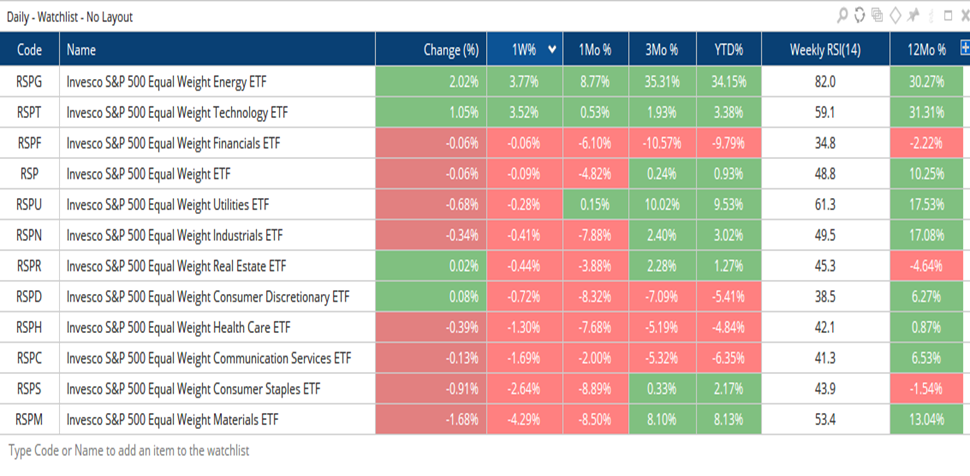
Only Technology and Energy have turned in positive returns (greater than +3% based on Equal-weighted ETF’s by Invesco) while defensive sectors like Consumer Staples have actually underperformed nearly every sector.
Furthermore, sectors like Materials have underperformed all other sectors, largely due to the underperformance of precious metals and mining, but other areas like Chemicals have also weakened. This is interesting because many soft commodities have turned higher, and as investors realize, yield curves have flattened out dramatically in recent days, given the thoughts of inflation returning to markets.
Overall, Technology outperformance is a constructive factor, but breadth has waned substantially in the last few weeks, given the deterioration in Industrials, Consumer Discretionary, Financials, and Materials, among others.
Bottom line, even a 3%+ rally in Technology hasn’t proven enough to “save” the market, and both ^SPX and QQQ fell to new lows for the year today. Seeing some outperformance in other sectors is critical to having more confidence in the market’s ability to try to bottom out. This likely will take time, as relative charts of Technology vs. ^SPX seem to have now arrived at resistance.
The performance figures below are ranked based on Equal-weighted ETF returns sorted by 1-week performance.
Invesco S&P 500 Equal Weight ETF
Technology is likely going to stall out, given Equal-weighted ratio of Tech vs. SPX having risen to resistance
Seeing Equity markets weaken as Technology is rising is unusual indeed, but much of this can be traced to outperformance in Memory and Optical names, which were recently discussed over the last few days.
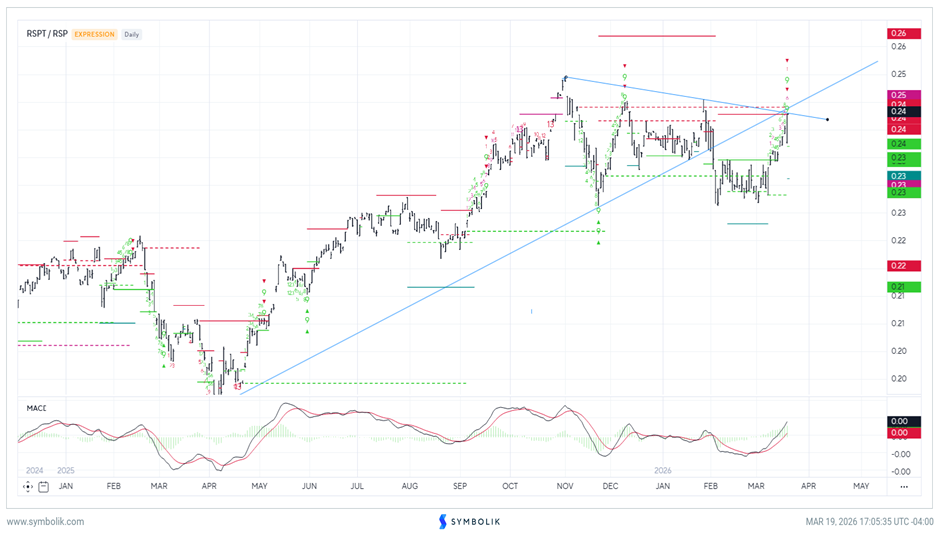
As shown below, Technology now looks to be up against strong resistance in Equal-weighted terms, and the sector has rallied to test two separate trendlines while TD Sell Setups are apparent on daily charts of RSPT vs RSP.
This looks to be a difficult spot for “Tech” after a constructive bounce, and I feel it’s imperative to keep a close eye on stocks like MU, CIEN, WDC, STX heading into next week.
If this relative chart has any relevance, it points to a good likelihood of Technology stalling out and facing possible consolidation into late March.
RSPT/RSP
When looking at CIEN STX, DELL, ACN, LRCX, WDC, these all outperformed on Thursday’s decline and were all up more than +3.50%. That is highly unusual for a market that broke down earlier in the session to new monthly lows.
They gained ground into Thursday’s close, and Technology proved to be one of Thursday’s best-performing sectors. However, in each of their respective cases, these stocks are now nearing resistance following this sharp rally, and my expectation is for a slowdown and reversal in Technology after this recent outperformance.
If my analysis is right, then these stocks should find strong overhead resistance at the following levels:
CIEN- $415-$420
STX- $434-$450
DELL-$59
ACN- $217
LRCX- $240-$250
WDC – $320-$325
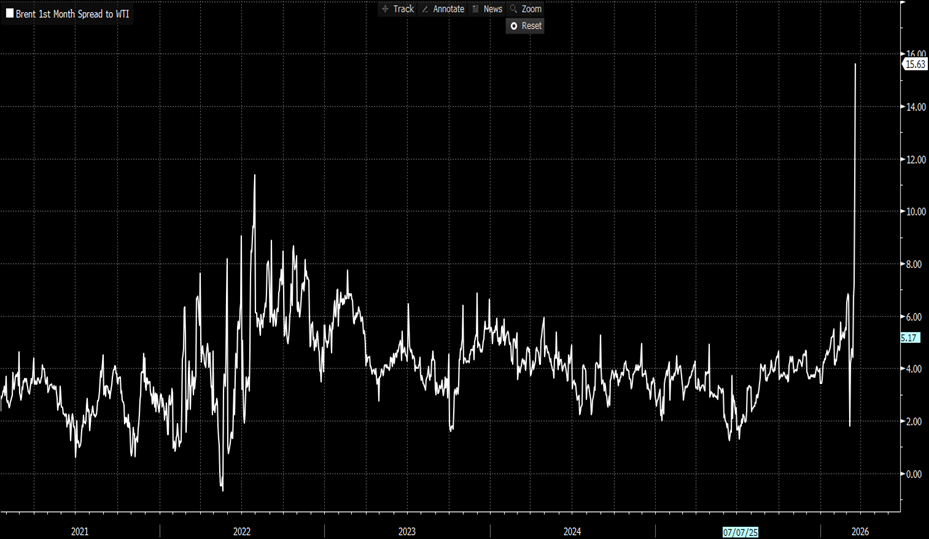
Brent Crude oil broke out vs. WTI Crude and has been massively outperforming
It’s important to note that Brent Crude oil has broken out and is outperforming WTI Crude oil in a big way over the last couple of weeks.
This is thought to mean that any stagflationary effect given the Iran War might prove to be stronger in Europe or Asia than in the US, which is already Energy independent, and doesn’t have as strong a need for Oil and Gas imports.
Brent 1st Month Spread to WTI
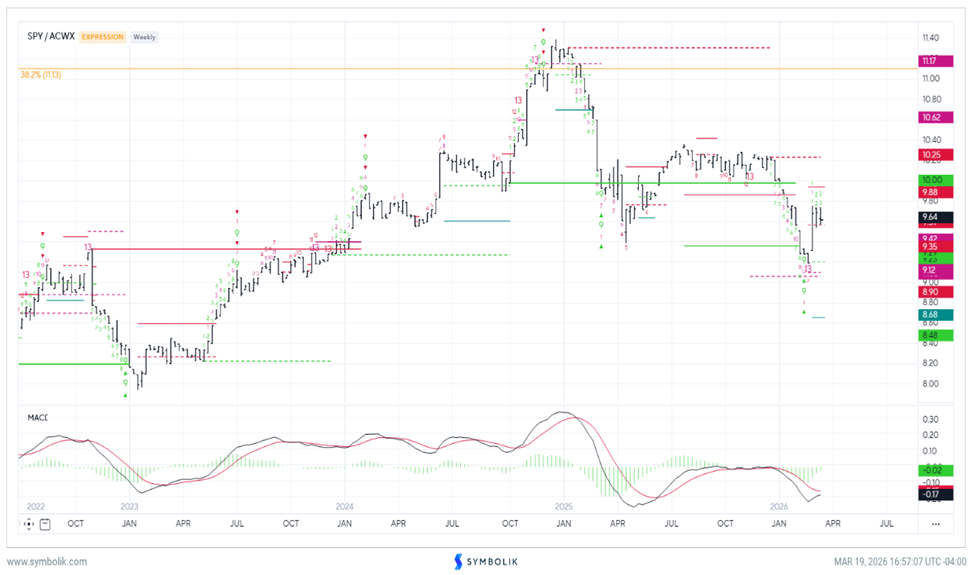
US has turned back higher vs. the All Country World index in the last couple of weeks following its underperformance since last fall
Another interesting phenomenon concerns the performance of US Equities vs. the All-Country World Index (ACWX), which bottomed in early March and has risen back up above prior lows in the last week.
Part of this outperformance can be explained by US Technology doing as well as it has in the last week despite falling Equity markets.
However, this also speaks to the degree (similar to the chart above) of US assets largely proving less volatile given US Energy independence, and US equities, along with Treasuries and WTI Crude oil, have not proven as volatile this past week.
The chart shown below is SPY vs ACWX, or SPY vs. the All-country world index, which has rebounded sharply after its recent decline.
SPY/ACWX