


Near-term US Equity trends could be starting to give way to upside progress if Thursday’s reversal shows some follow-through on deal progress into Friday. The combination of Treasury yields, the US Dollar, and WTI Crude oil all showing technical evidence of breaking down tilts the near-term risk back to the upside and makes a negative stance increasingly difficult to justify. While I had expected a bit more weakness into next week at a minimum, it’s important to pay attention to what multiple asset classes all seem to be suggesting. I feel that QQQ and ^SPX need to eclipse 717.50 and 7,430, respectively, before being able to confirm this consolidation has run its course. However, even on a completed deal, I feel it is still right to give sectors like Healthcare, Financials, and the Consumer sectors some consideration. Furthermore, a push into Equal-weighted ^SPX still looks to be the correct move vs. ^SPX between now and mid-term elections. Thus, while I’m encouraged about the possibility of an imminent deal, I also harbor skepticism that it’s right to push back into Technology, expecting that this sector should outperform in the months ahead. The next 3–5 days should shed some light as to the likelihood of any ceasefire sticking, and what the investor appetite is for the SpaceX IPO.
^SPX’s sharp about-face stalls the pullback, but no breakout of the early-June downtrend has occurred yet
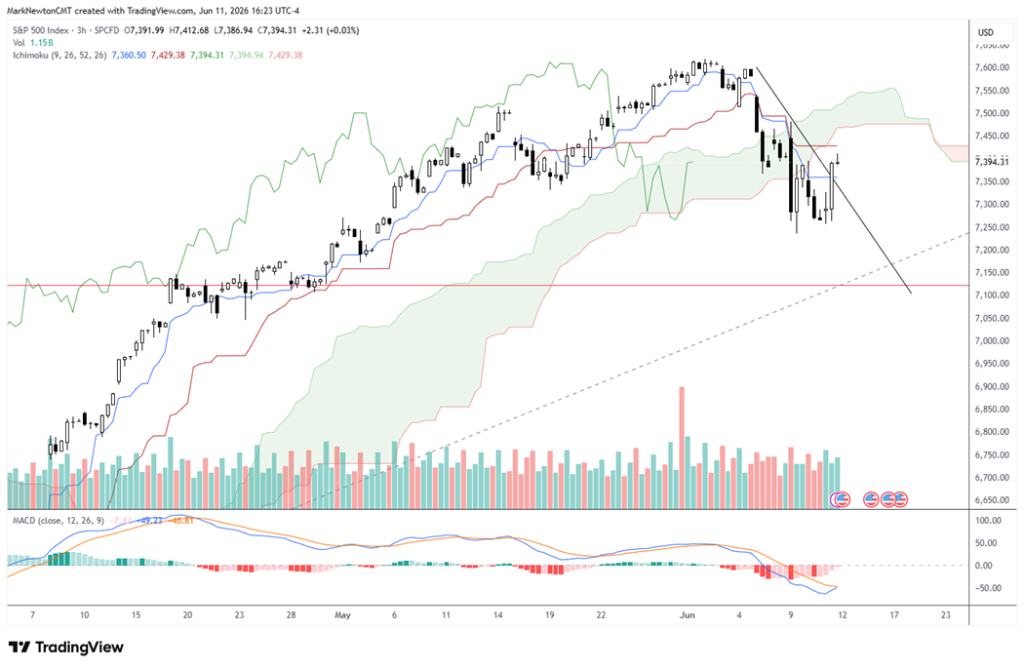
^SPX rallied 1.75% Thursday to close at 7,394, a sharp about-face that recovered the downtrend from early-June highs and opens up the possibility that the selloff might prove short-lived.
This rebound very likely stalls the near-term pullback, but given the negative momentum, it remains difficult to have conviction about an imminent move back to new highs without official proof of a completed Iranian deal.
As discussed above, ^SPX requires a daily close above 7,430, while QQQ, for its part, needs to recoup 717.50. The next week should help shed some light on the ability of trends to stabilize and immediately push higher, or whether this might still take some time before a move to new highs gets underway.
S&P 500 Index (^SPX, daily) – Thursday’s about-face stalls the pullback, but a close above 7,430 is needed to confirm a breakout of the early-June downtrend
WTI Crude sits on the verge of the much-anticipated breakdown; a close under $85.95 targets $60 into September
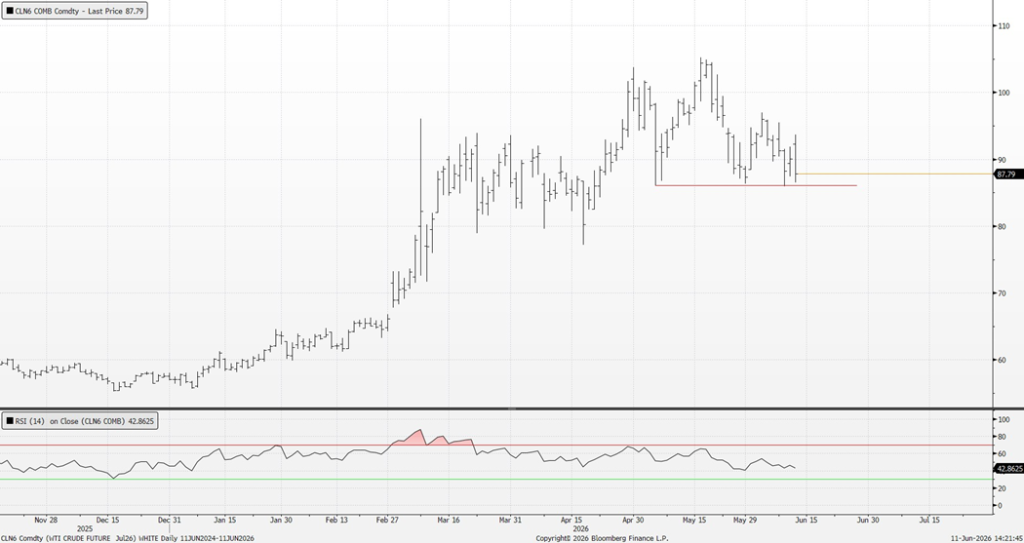
WTI Crude traded down sharply to test support on Thursday as a ceasefire deal finally seemed to be near completion. Daily charts show three separate rally attempts since April that have all given way to failure, while price held the support near $86 that had contained each of the last three drawdowns.
That support now looks to be giving way, with Crude already slipping under $85.95 in the after-market — a positive for the breakdown thesis, though many who will be apt to label this a head-and-shoulders pattern should note it is not truly validated until a daily close under $85.95, this past Tuesday’s intraday low.
I expect this to play out in the days ahead and to jump-start a collapse toward $60 into September, leaving both Crude and the Energy sector vulnerable to meaningful downside and continued underperformance. A breakdown here also reinforces the risk-on backdrop for Equities, consistent with my contention that an Iran deal should prove imminent.
WTI Crude Oil Front-Month Futures (CL1!, daily) – Three failed rallies since April leave Crude on the verge of a breakdown, with a close under $85.95 targeting $60 into September
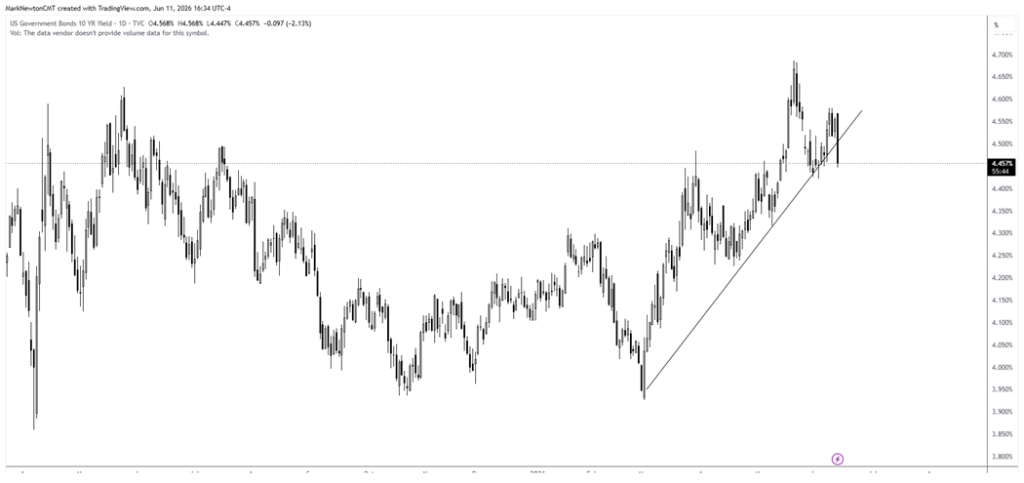
10-year Treasury yields violate the rising uptrend from the March lows, supportive of risk assets
The 10-year Treasury yield (^TNX) fell over 2% Thursday to close at 4.457%, violating the rising trendline from the March lows on a closing basis. This break should allow yields to retreat further in the days ahead, back down toward the early-May pivot near 4.30%.
The US Dollar sits in a similar position, having pressed a rising uptrend that also looks to be giving way, and the combination of ^TNX violating its trend alongside Crude trading under $86.95 is supportive of risk assets and argues for a likely further bump in Equities.
US 10-Year Treasury Yield (^TNX, daily) – Thursday’s close violates the rising trendline from the March lows
Financials look poised to break out of a five-month relative downtrend, a sector to favor for those looking outside of Technology
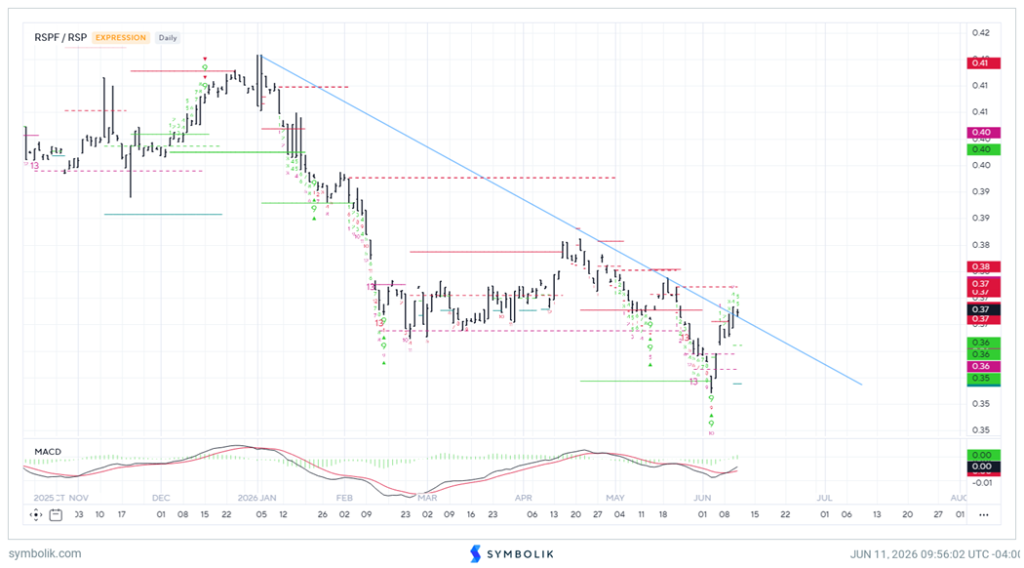
The relative chart of Financials versus the broader market has spent the better part of the last year grinding lower beneath a well-defined descending trendline, and the near-term trend looks close to turning back higher.
In the short run, a few interesting developments have happened since late May:
- Momentum has begun to improve, and weekly MACD has started to curl back higher.
- Relative charts of Invesco’s Equal-weighted Financials (RYF) vs. Equal-weighted ^SPX are now on the verge of breaking the downtrend from earlier this year.
Financials have proven to be a difficult sector to favor technically in the last year for outperformance. It’s thought that this week’s challenge of this downtrend will likely give way and help Financials start to recover.
S&P 500 Financials Relative to the S&P 500 – Breakout of the multi-year descending relative downtrend looks imminent
______________________________
PS: If you are enjoying our service and its evidence-based approach, please leave us a positive 5-star review on Google reviews —> Click here.