


The most important takeaway from this week is that significant weakening has started to happen across interest rates, the US Dollar, and WTI Crude oil, coupled with some constructive sector participation that was conspicuously absent over the past month. This broadening out across sectors helps to add conviction that lows might very well be in place for now, and ^SPX might not require a pullback under this week’s lows. While it’s difficult to expect an immediate push to new highs barring a completed deal to open the Hormuz Strait, I do feel this past week’s lows likely can hold for now, given the constructive nature of various sectors starting to show convincing technical strength. Overall, this is a much more positive bias than what was the case last week, and while parts of Technology remain quite overbought, it seems right to favor that a deal should be imminent, making it right to shelve a defensive stance.
Importantly, this week’s market resilience on the announcement of an interim deal has caused sufficient technical weakening in Crude, the US Dollar, and Rates to make a finalized deal seem like more of a reality than was the case a few weeks ago. Market weakness and the short-term downtrend were impressively contained at roughly six trading days (with one of those being positive) and snapped back sufficiently this week to result in a positive weekly close.
I don’t view this as a signal to rush back into Technology. A push into Equal-weighted ^SPX still looks like the correct move versus cap-weighted ^SPX, given the ongoing overbought nature of Technology. Moreover, the leadership this week from REITs, Materials, Industrials, and Financials reinforces that the broadening — not a narrowing back into Mega-cap Tech — is the right way to play this. Sectors like Healthcare and the Consumer groups also deserve consideration here for those looking outside of Technology.
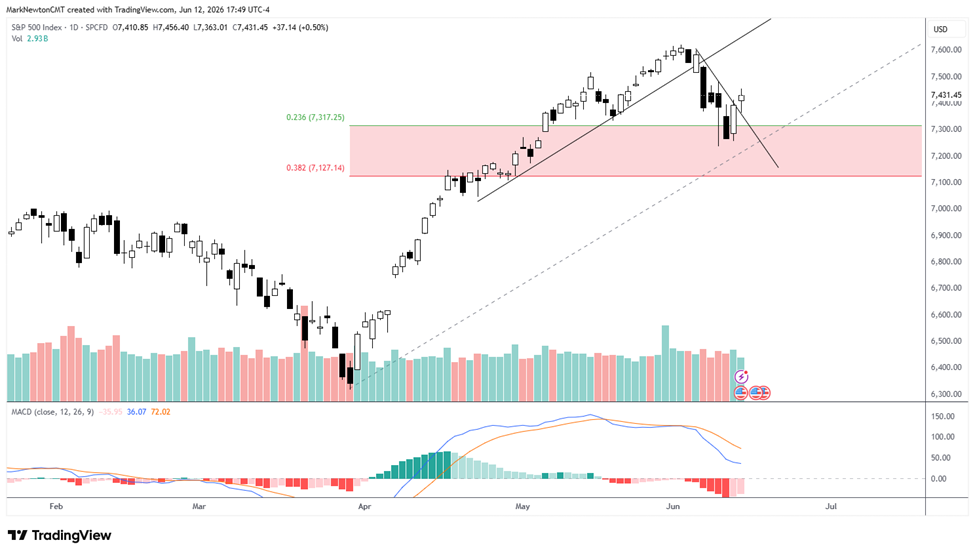
^SPX’s close at 7,431 reclaims the 7,430 pivot and likely marks the end of a one-week pullback
^SPX rallied to close at 7,431.45 Friday, up 0.50%, reclaiming the 7,430 level I had flagged Thursday as necessary to argue that the early-June consolidation had run its course. While near-term momentum remains in need of some improvement, the one-week decline failed to cause weekly momentum to roll over, and barely any technical damage was done before an immediate snapback.
Heading into next week, I am skeptical that an immediate push to new highs will happen until a completed deal can be confirmed. Furthermore, incoming Fed Chair Warsh’s first FOMC meeting (as Fed Chair) promises to cause some possible near-term uncertainty until markets can grow more comfortable with his outlook.
However, the broad-based participation helps to give a bit more comfort with the idea that lows very well could be in place for now, and this cycle might invert to drive asset prices higher, not lower as previously expected. Near-term resistance lies at a zone from 7,476 up to 7,517, while support should contain pullbacks between 7,343–7,370 next week.
S&P 500 Index (^SPX, daily) – Friday’s close at 7,431 reclaims the 7,430 pivot, though the early-June downtrend has not yet fully given way
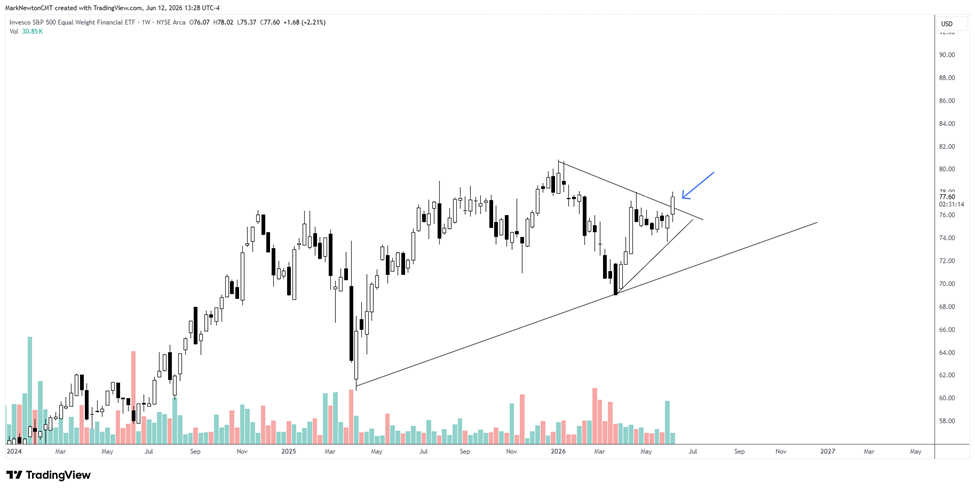
Financials break out of a multi-month consolidation — and it’s the Banks, not the Brokers, leading the move
The weekly chart of the Invesco S&P 500 Equal Weight Financial ETF (RYF) closed up 2.21% at 77.60 on Friday, breaking out above the descending trendline that had capped its consolidation since late 2025. This absolute breakout now complements the relative breakout versus Equal-weighted ^SPX that I discussed in yesterday’s piece as Bank stocks have begun to show more compelling evidence of strengthening.
Financials are extending gains here, but what stands out is that it’s been the Banks leading this move rather than the Broker-dealers, which might seem odd at a time of curve-flattening (bull flattener). Oil falling — with the prospect of a larger decline on a completed deal — might be compressing inflation expectations, yet the front end of the curve remains pinned up by hot realized inflation.
One would suspect that if a completed Iran deal leads rates to fall, this would normally bring about a push higher in Broker-dealers, not Banks, on a revived risk appetite.
Thus, since IAI has trended lower vs. Banks since August of last year (though they outperformed from February into May), I sense this Banks outperformance is more about Regional banks and the Equal-weighted trade kicking into gear. While stocks like GS and MS remain trending higher and look technically quite attractive, stocks like C, BAC, HBAN, FITB, and USB have all shown excellent technical strength and rallied more than 5% this past week.
Overall, the Banks look to be in great technical shape in the near-term, and it’s encouraging to see a broad-based rally from this group instead of a rally in just a handful of select Investment bank stocks.
Invesco S&P 500 Equal Weight Financial ETF (RYF, weekly) – Breakout above the multi-month consolidation downtrend
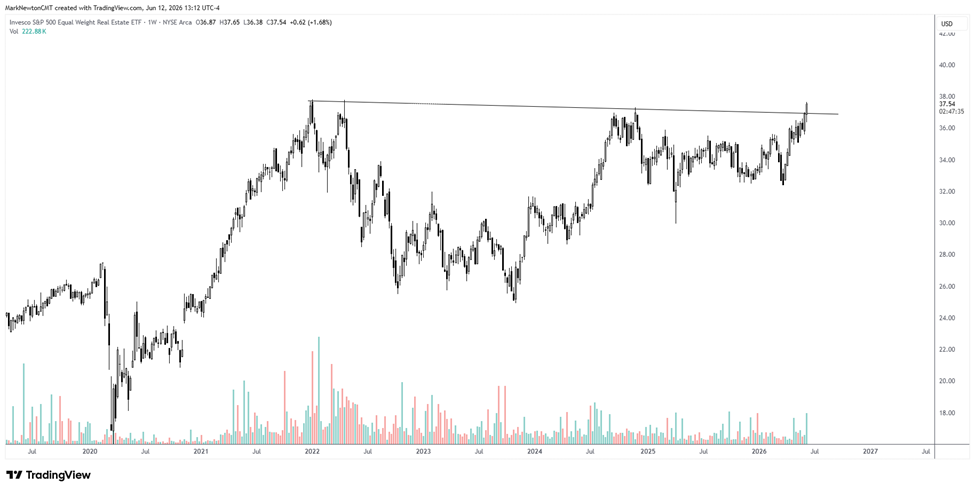
REITs break out to new all-time highs on an Equal-weighted basis; REITs remain a technical Overweight
The weekly chart of the Invesco S&P 500 Equal Weight Real Estate ETF (EWRE) has officially broken back out to new all-time highs as of this week’s close.
As shown below, this represents a breakout of a multi-year bullish cup-and-handle pattern that should benefit REITs at a time of interest rates starting to turn lower on a completed deal.
I expect EWRE to trend higher toward $42 in the months to come, and expect that REITs should be an area of outperformance. My current technical rating on the REIT sector remains an Overweight and is certainly reinforced by this week’s breakout.
My favorite 10 REITs at this time technically are: WELL, SPG, IRM, EQIX, PSA, VTR, DLR, PLD, REG, and HST.
Invesco S&P 500 Equal Weight Real Estate ETF (EWRE, weekly) – Breakout to new all-time highs confirms the multi-year cup-and-handle pattern
Yen looks to finally be nearing a time to strengthen as the US Dollar could decline sharply in the near-term to mirror a drop in long rates
USD/JPY traded down sharply to multi-day lows on Thursday on the news of a possible completed Iran deal, and should be on the verge of a larger decline (Yen rally).
The technical act of having stalled near April peaks looked important initially following the intervention, which happened back in late April.
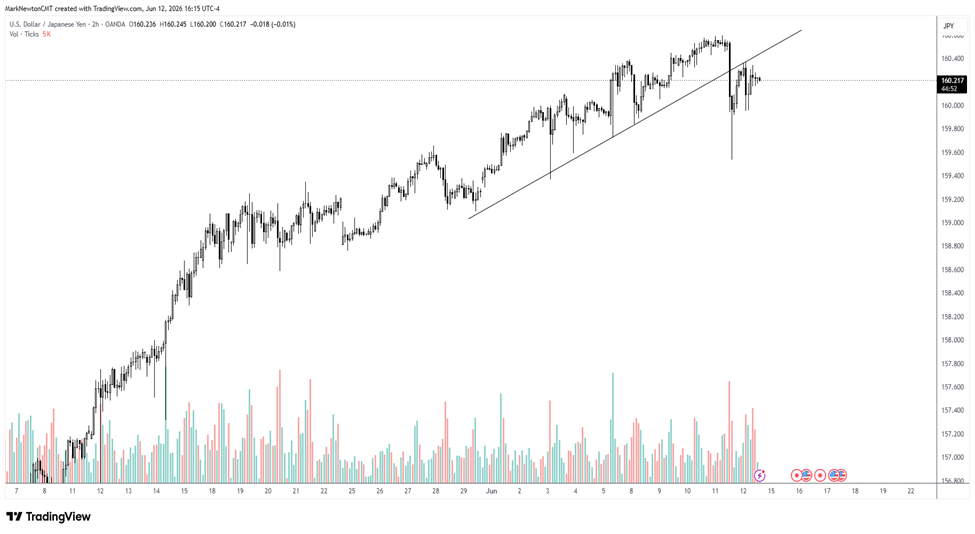
While the weekly chart doesn’t show much technical evidence yet of a breakdown, the hourly USD/JPY chart shows the break of a multi-week trend following the successful challenge of April peaks.
Overall, this pullback to new multi-week lows on Thursday looked to be the key “tell” which reinforces my view of a coming fall in the US Dollar coinciding with a cross-asset breakdown across Crude and Treasury yields.
I sense that a coming pullback to test May lows could be underway, which might provide a short-lived but sharp rally in the Yen ahead of a likely weakening in the back half of 2026.
At present, any daily close under 160.16 should jump-start a decline in USD/JPY that might last over the next couple of months before some support and a snapback rally happens into year-end.
US Dollar / Japanese Yen (USD/JPY) – Sharp reversal on Thursday likely kicks off some temporary strength in the Japanese Yen (USD/JPY weakness) for the months ahead
______________________________
PS: If you are enjoying our service and its evidence-based approach, please leave us a positive 5-star review on Google reviews —> Click here.