


Note: As part of our transition from FS Insight to Fundstrat Direct, my daily notes will transition from mark.newton@fsinsight.com to mark.newton@fundstratdirect.com. Please add the new address to your contacts or safe sender list to ensure uninterrupted delivery. The research and insights you rely on will remain exactly the same — only our name and sender address are changing. If you have questions, please visit our FAQ here.

Near-term SPX trends remain bearish, and trends and momentum remain negatively sloped while market breadth is in dire need of immediate recovery. For now, the risk-on trade remains captive to WTI Crude oil and progress in reopening the Hormuz Strait. In the short run, both WTI Crude and US Treasury yields look to push higher, and until there is some evidence of the recent cross-asset volatility starting to stabilize a bit, it remains tough to buy dips in Equity markets within this downtrend with any confidence. Until evidence of capitulation arises, any near-term bounce that my work suggests begins next week would likely prove short-lived before additional selling pressure into April/May. This directly lines up with a time when Cryptocurrencies might concurrently experience weakness before a market bottom happens this spring. Overall, sentiment is getting more negative, but there hasn’t been capitulation, and momentum, technical structure, and breadth have weakened lately. Most investors should arguably continue to favor a heavily diversified stance and overweight defensive sectors like Utilities, Telecom, and Pharmaceutical stocks until Technology can show more evidence of stabilization.
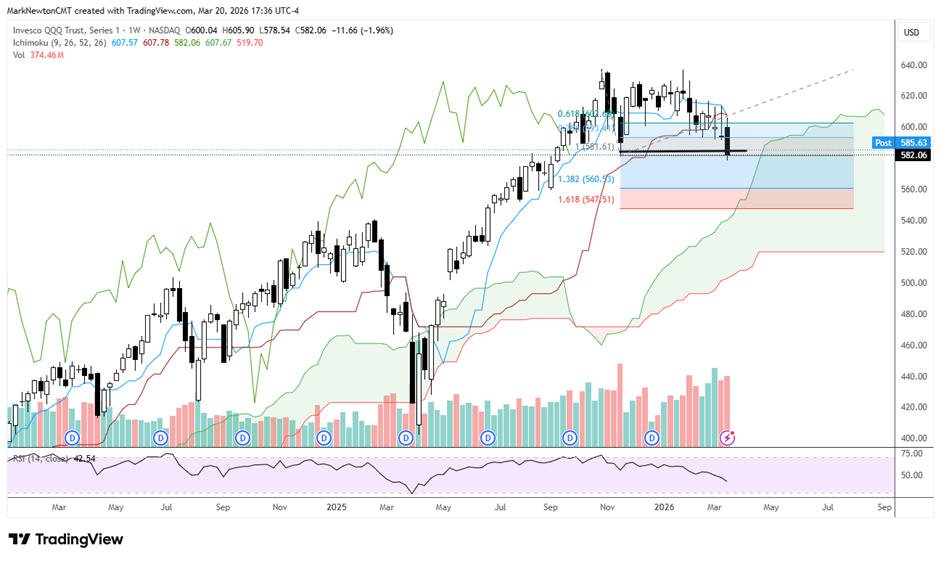
U.S. equity indices closed at the lowest levels of the year on Friday, and both ^SPX and QQQ undercut last November’s lows, which were thought to potentially act as mild support.
Unfortunately, despite bearish sentiment increasing, the US, along with many international Equity indices, remains captive to WTI Crude oil, along with interest rates, which have been repriced given the effects of Crude’s rise in recent weeks.
While normally the area surrounding the Spring Equinox, from a timing perspective, can bring about lows in Equities when prices trend into the beginning of spring, it’s hard to have too much confidence just yet in any low being “The Low”, but rather just “a low”.
Why it’s tough to have too much confidence yet for US Equities, even if a short-term bottom happens early next week:
- US Equity indices are not oversold, whether on a daily, weekly, or monthly basis.
- Evidence of capitulation is not yet present, which initially revolves around above-average downside volume occurring compared to upside volume, which would trigger a high Arms Index reading (TRIN).
- US and many European interest rates have just broken out, exceeding meaningful bases that had kept yields largely range-bound in recent months. (This sudden breakout resulted in an expansion of volatility, which was seen as a negative for Equities.)
- WTI Crude oil continues to push higher and does not seem to have peaked out. Given that the initial breakdown in Equities happened as Crude pushed higher, I suspect that some type of stabilization in the Middle East might prove necessary (or, at a minimum, an opening of the Hormuz Strait to allow unfettered access to tanker travel). My target on WTI Crude is $110-$115, but WTI is moving up much slower than Brent Crude, and Brent’s escalation could prove more problematic for Europe.
- Breadth has broken down lately, based on “Percentage of stocks above 20, 50, 200-day moving averages and/or “percentage of stocks within 20% of 12-month highs.” Despite McClellan’s Summation index having gotten oversold, this is not a reliable gauge for a market bottom.
- DeMark indicators are premature in showing exhaustion that would allow for a bottom in US Equities on either a daily or weekly basis.
- Many other sectors have weakened this past week, and this was not a Technology led decline. This could prove problematic if/when “Tech” now starts to weaken in the days/weeks ahead, given Semiconductors and/or Memory/Optical stocks starting to turn lower.
To the markets’ credit, the period from March 23rd to 24th of next week looks important based on short-term cycles, and March/April normally is quite positive in mid-term election years. However, as we know, the cycles are quite different this year than normal, making the use of seasonal studies like this less than ideal.
Invesco QQQ Trust, Series 1
Semiconductor stocks would be vulnerable on an SMH break of $369
As discussed over the last week, there very well could be a rotation back lower in both Memory stocks, Optical names, along with many of the Semi, and Semi-cap Equipment stocks before the US stock market bottoms.
If this doesn’t happen next week and indices stabilize and begin to rally, then I believe this would happen into April and cause a “final” selloff for Technology into April/May before a bottom and a meaningful rally into Summer.
As shown below, this pattern resembles a “potential” Head and Shoulders pattern technically, which has been forming for the last couple of months.
It’s always important to reiterate that Head and Shoulders patterns are not valid until the “neckline” is violated, which in this case lies at $374.16.
Coincidentally, this also lines up with a lengthier uptrend and Ichimoku support, which starts around 368 and extends up to 374.
Thus, until/unless $368 is violated, I still feel trends are fine for “Semis” but am certainly watching carefully the parts of Technology which have been strong lately but have gotten overbought and have begun to stall a bit over the last couple of weeks.
My theory is that in 2026, most parts of Technology will likely experience a selloff and exhibit the kind of selling pressure that was seen in Software this year. Since Software’s decline has already played out, my thinking is that this area should hold up relatively better, and Semiconductors might next be vulnerable. While this hasn’t started yet, under $368 would be problematic for this group.
VanEck Semiconductor ETF
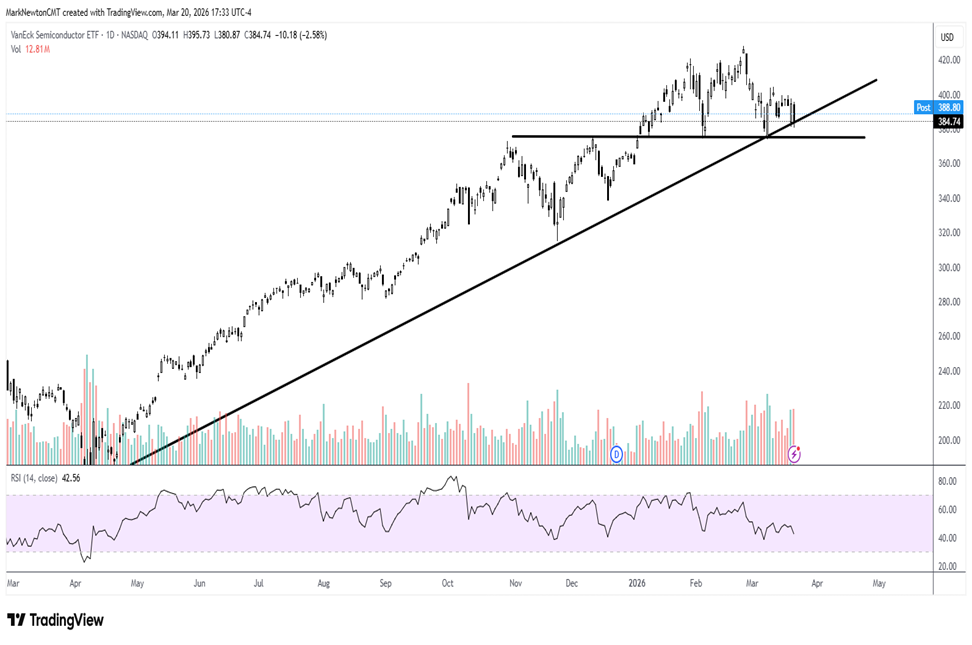
Source: Trading View
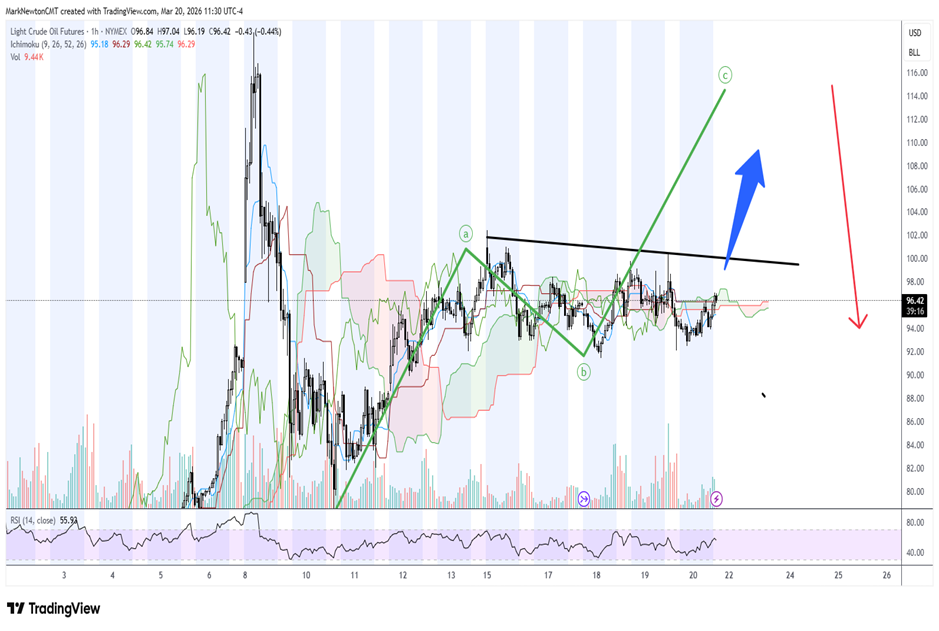
If Crude oil strength coincides with Equity weakness, then a peak is likely needed for Equity stabilization, and that still looks premature
The key takeaway heading into the weekend is that WTI Crude oil still looks to have the chance to push up to $110-$115 over the next few weeks.
If this happens, then it’s difficult to have a lot of confidence buying dips in Equities, given the correlation that we’ve seen over the last couple of weeks with Crude’s rally coinciding with Equities moving lower.
$100 looks to be the key line in the sand heading into next week, given this past week’s minor consolidation. Movement over $100 should allow for a push-up to test prior highs, which might end up being a strong level of resistance.
At present, I am still anticipating higher Oil prices into April before a peak, and so WTI and Brent Crude have to be watched carefully along with Natural Gas next week.
Light Crude Oil Futures
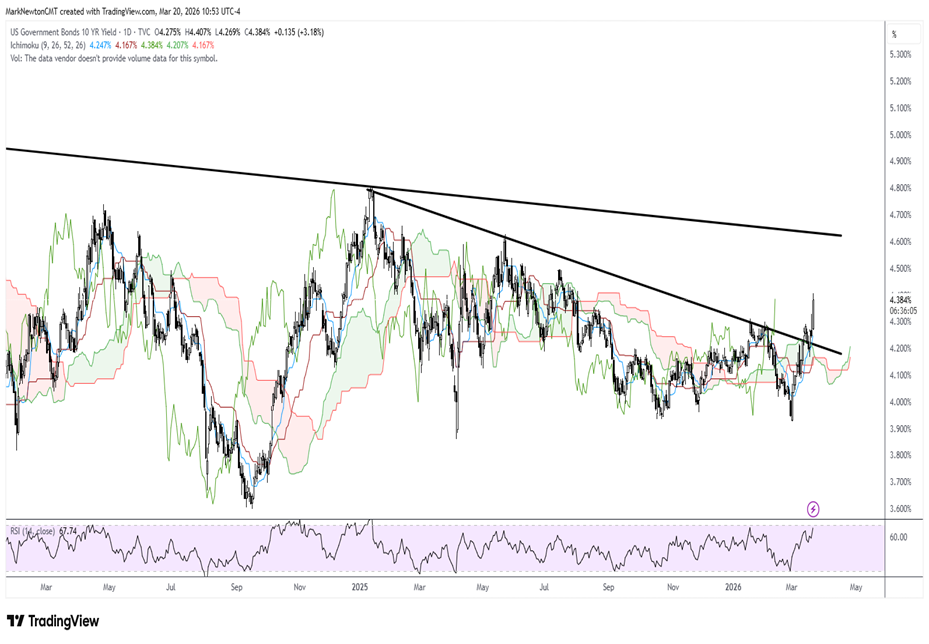
Treasury Yields have broken out for the US, UK, and Germany
It’s important to keep a close eye on Treasury yields as the breakout of multiple past months of consolidation is not something many investors have been concentrating on lately.
Technically speaking, the act of exceeding a high that’s held for months often gives way to a burst of energy, in this case to the upside for yields.
As shown below, the US 10-Year Treasury Note Index yield exceeding 4.29% resulted in a sharp acceleration higher in yields up to 4.384%, while most of Europe moved up much quicker.
When Treasury yields, the Dollar, and Equities all begin to show volatility simultaneously, it makes it incredibly difficult to buy into this kind of cross-asset volatility right away, particularly when there’s no evidence of true capitulation.
Technically, I can make the case for the next 3-5 days to potentially bring about a short-term peak in Treasury yields, and I do not expect a move over 4.60%. Yields very well might hold 4.45-4.55%, but the next 2-3 days still look to trend higher as a result of Friday’s continuation of the breakout of resistance.
The chart below highlights 10-year Treasury yields, but I suspect the 30-Year Treasury yield might hold 5.15% and not move much higher.
US Govermment Bonds 10 YR Yield