


Note: As part of our transition from FS Insight to Fundstrat Direct, my daily notes will transition from mark.newton@fsinsight.com to mark.newton@fundstratdirect.com. Please add the new address to your contacts or safe sender list to ensure uninterrupted delivery. The research and insights you rely on will remain exactly the same — only our name and sender address are changing. If you have questions, please visit our FAQ here.

Near-term SPX trends remain bearish, and trends and momentum remain negatively sloped as WTI Crude’s rally continues to be a factor that Equities have responded negatively to in recent weeks. Until evidence of capitulation arises and/or meaningful structural improvement, along with breadth and momentum starting to turn higher, it’s thought that yet another pullback to new lows could be possible over the next couple of weeks that would more clearly line up with a time when risk assets might stabilize. Overall, sentiment is getting more negative, but there hasn’t been capitulation, and trends in long-term interest rates along with WTI Crude and the US Dollar remain pointed higher. Most investors should continue to favor a heavily diversified stance and overweight defensive sectors like Utilities, Energy, Telecom, and Pharmaceutical stocks until Technology can show more evidence of stabilization.
^SPX has now dropped to challenge last Friday’s lows, which were thought to be important at 6473-5, given the options Put collar that JP Morgan has, which expires at the end of March. (I was alerted that this represents the upper end of this Put spread, and thus is a long gamma position for them, not short, thanks to my old friend from Diamondback, Alon Rosin.)
While this might have importance as an area of support for Friday, given the Administration’s pause of the Energy plant destruction to 4/6/26 (per Donald Trump’s comments), it still seems like Equities could face weakness into next week as QQQ has undercut last week’s lows.
Given the breakdown in stocks like META and GOOGL lately, with NVDA and SMH on the brink of possible support violation, it’s going to be very important to concentrate on the “Magnificent 7” into next week.
Furthermore, the deterioration in other parts of Technology recently, like Memory stocks, optical stocks, and many Semiconductor names, is notable and important to watch carefully.
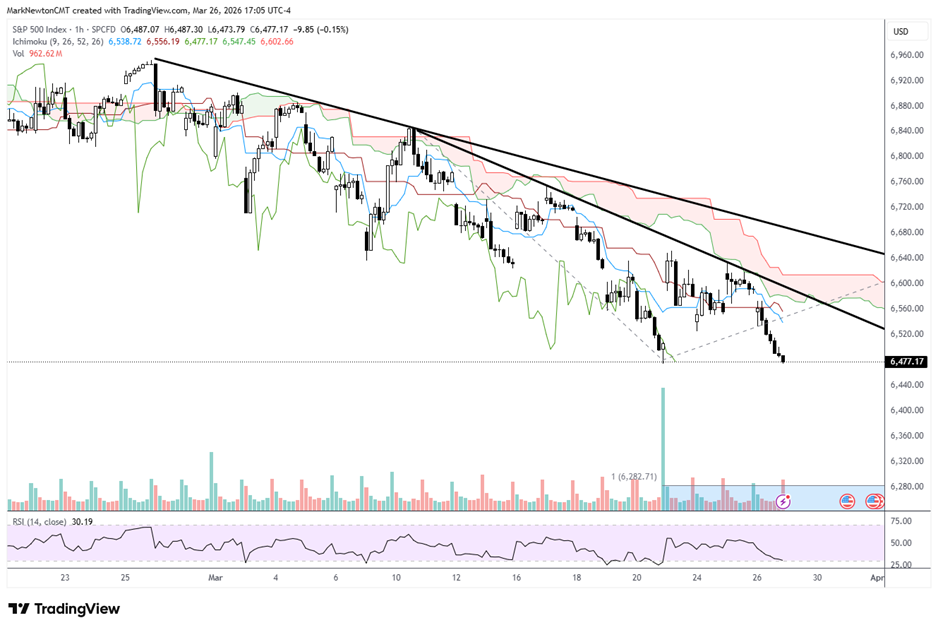
For now, this hourly ^SPX chart shows the extent of this recent downturn and how it looks from the latter part of February when viewed on an hourly basis.
As seen below, there continues to be a “wall” of resistance directly overhead near 6600, and until Crude and Treasury yields stop climbing and/or a meaningful ceasefire agreement is reached, it’s still thought to be likely to see weakness in April.
However, at current levels, 6475 does have importance, but if broken, might not have much support until the 6230-6300 area over the next couple of weeks. Such a level would likely represent a very attractive risk/reward area for Equities for the next month.
S&P 500 Index
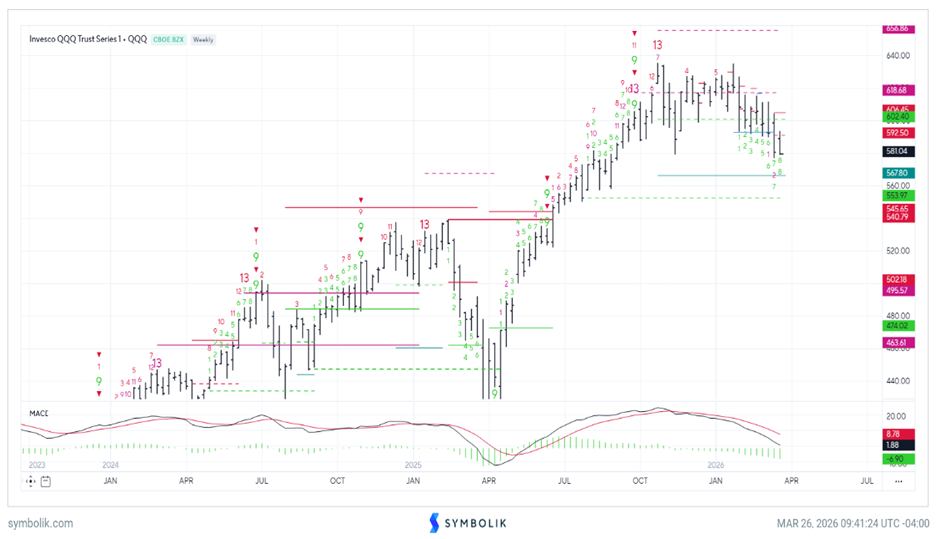
QQQ does show the potential for a weekly exhaustion signal next week
QQQ very well could be near a tradable bottom as early as 1-2 weeks based on DeMark’s indicators.
While the daily exhaustion signals per DeMark theory remain lacking, the weekly chart of both QQQ and SPY seems to offer some support towards the thinking that lows could be right around the corner.
As shown below, QQQ looks to be on the verge of forming its first weekly TD Buy Setup using TD Sequential’s countdown process since the decline began back in January.
While this has not yet been perfected, my view is that the area near 567 represents a very good area of appealing support. This is just below Thursday’s close of $573.69, and I expect that QQQ forms a low between 560-567 in April.
Overall, this is a counter-trend view, only incorporating the signals of this chart below. As many are aware, having multiple indicators, along with fear gauges, trigger “buys” would help to establish more confidence.
Invesco QQQ Trust Series 1
Bond yield breakout remains something to concentrate on, which many continue to ignore
While many investors are studying 200-day moving averages of ^SPX, I feel it’s far more important to concentrate on the cross-asset volatility and what’s been happening with Treasury yields and Crude oil. Given that Equity indices broke down when these started breaking out, they remain a key piece in the puzzle for those studying near-term ^SPX direction.
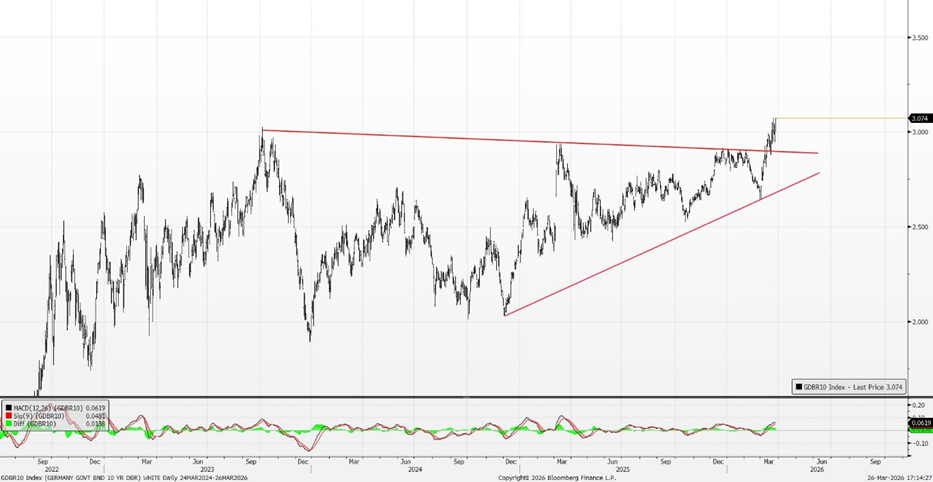
The breakout in both yields and Crude coincided directly with the decline in support for Equity indices a few weeks ago. Both the charts of US 10-Year Treasury Yields and 10-year German Bund yields look to push higher into April.
My feeling is that it’s important to pay close attention to these for those looking for clues on US equities. Furthermore, next week might prove important with regard to important Economic data coming out, which might prove important for the bond market.
Below is the 10-Year German Bund Yields, which made a very meaningful and positive (positive for bond yields going up) breakout of a multi-year pattern. Both Bund and Treasury yields closed near their highs of the day on Thursday, which should lead both of these higher over the next couple of weeks before a possible reversal.
GDBR10 Index
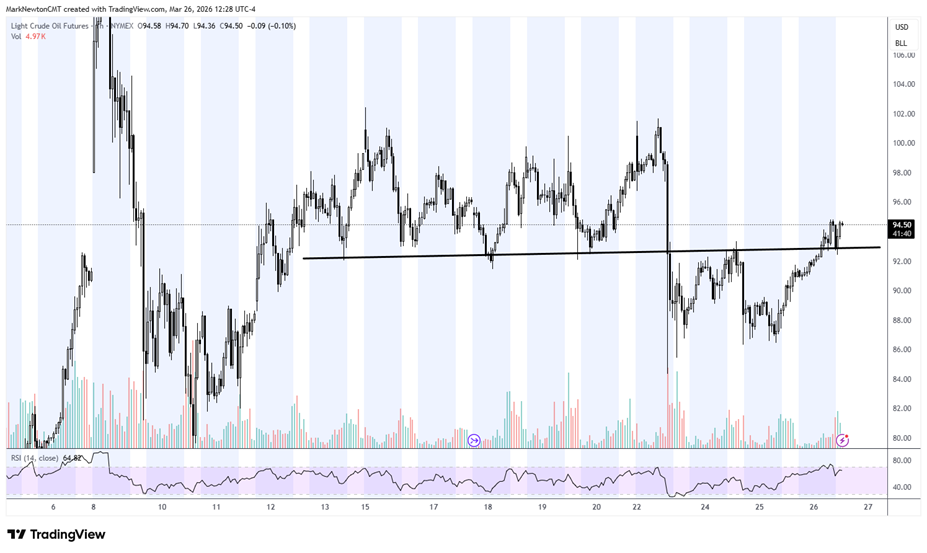
WTI Crude oil has recaptured the former area of the breakdown, which is bullish for Crude over the next couple of weeks
As might have been expected, the initial efforts to suggest a cease-fire/negotiation with Iran failed to work out, and the initial drop in WTI Crude proved short-lived.
In the last couple of days, WTI Crude has pushed back above the area of its prior breakdown, which is bullish technically speaking.
My thinking is that this recovery of prior lows should now allow for WTI Crude to push up to $110-$115, which lines up with resistance for Crude into April.
Light Crude Oil Futures
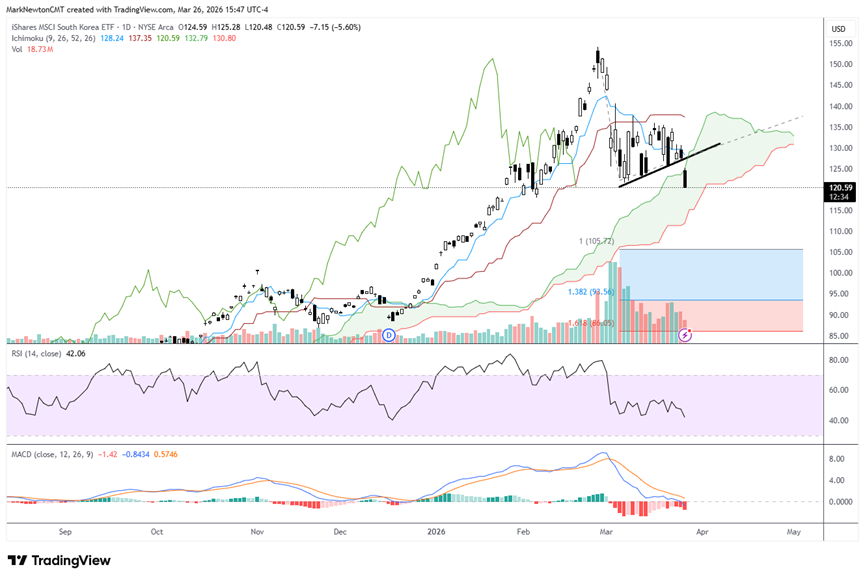
South Korea ETF breakdown points to additional weakness, which is being felt by many Emerging markets as the US Dollar rallies
The degree of concentration in South Korea is far greater than in the US Stock market, so when key Semiconductor stocks start to weaken, it causes a greater-than-average drop in this iShares MSCI South Korea ETF (EWY).
Today’s breakdown makes a drop down to $115-$117.50 likely over the next 3-5 trading days.
However, given the Ichimoku Cloud support, I’m reluctant to think this will show weakness down to $105 just yet based on today’s breakdown.
If/when $115 does get broken sometime in April, however, the area near $105 looks important as an alternative Fibonacci-based projection.
The key takeaway for today is that the breakdown in EWY likely leads to a bit lower over the next week.
iShares MSCI South Korea ETF
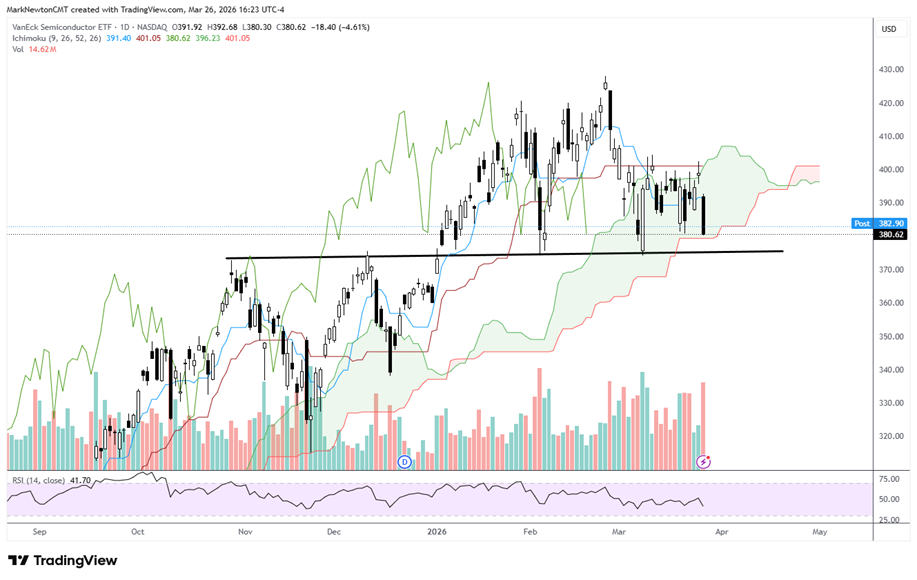
Semiconductor ETF (SMH) is nearing critical make-or-break territory
As might have been expected, Thursday’s drop in the Semiconductor sub-sector of Technology (“Semis”) was a warning of this Technology weakness starting to spread to different parts of Technology.
The key takeaway of this daily SMH chart (VanEck Semiconductor ETF) is that the price has now pulled back to near an important support area.
Under $374.16 would represent a breakdown of a multi-month Head and Shoulders pattern, which likely would cause further weakness in US Technology.
However, this has not yet happened, and it’s irresponsible to call this chart a true Head and Shoulders pattern without the break in the “Neckline” which connects the areas of support over the last few months.
Until this breaks, it’s difficult to make the call for a breakdown. However, key “Semi” stock NVDA has pulled back and is challenging its own important area near $171, which has an equal amount of importance and huge importance for ^SPX and QQQ, given its size.
This should be something to keep a close eye on next week, but for now, it’s right just to draw attention to this for purposes of monitoring further weakness into next week.
VanEck Semiconductor ETF