


Note: I will be traveling out of the country all next week, and there will be no reports, no videos until 5/26/26. If/when Equities show weakness that undercuts support, I will write a Flash insights report that details support levels if/when the levels in this report do not suffice. Thanks for your understanding.

Cross-asset volatility is starting to creep back into the picture, given a synchronized global push higher in long-end Treasury yields, both domestically and across most of the developed world. While US Equities have continued to grind to new all-time highs this week on the back of NVDA and the Mag 7 doing the heavy lifting, Friday’s session showed the first material signs of bearish reversal in both ^SPX and QQQ following a more than 17% rally in seven weeks — and the timing aligns precisely with the 5/15–5/19 cyclical inflection window I have been flagging. ^SPX 7,375 and QQQ 707.64 represent the key technical levels which, if violated on a daily close, would confirm what looks to be a three-wave Elliott-wave-style pullback of 3–5% into late May before a sharp rebound back into mid-to-late July and potentially mid-August.
The negative breadth divergences I have been cataloging in recent days continued to expand into Friday’s session, and the fact that this strong negative breadth reversal occurred directly within the 5/15–5/19 time window I have been flagging adds some conviction that this could be the technical inflection point. Combined with the price-and-time DeMark-based resistance approaching NVDA into Wednesday’s earnings — which I covered in detail in last night’s note — the building cross-currents make for an asymmetric risk/reward setup heading into next week.
It’s important to clarify that I do not view this as the start of any larger trend change. The structural uptrend in US Equities remains very much intact, with my cycle work pointing to a strong rebound off any late-May low back into the summer and potentially into mid-August. However, near-term technical caution looks appropriate, and trend-following discipline argues for tightening stops on long positions if ^SPX violates 7,375 on a daily close. A more decisive trend break would require breaking that pivot — until then, momentum is still arguably in the bulls’ favor, albeit with the cross-currents continuing to build.
^SPX and QQQ – Friday’s reversal raises the bar; a break of ^SPX 7,375 and QQQ 707.64 would confirm a three-wave Elliott-wave-style pullback into late May
Friday’s tape showed initial signs of bearish reversal in both ^SPX and QQQ following a more than 17% rally in seven weeks and directly coincided with a meaningful lift higher in long-term interest rates.
The key technical levels headed into next week are ^SPX 7,375 and QQQ 707.64. A daily close beneath these levels would constitute a meaningful break of the current near-term uptrend and would confirm what I expect to be a three-wave Elliott-wave-style pullback into late May/early June. My expectation is that the magnitude of this decline is likely to be relatively shallow, on the order of 3–5%, given that the broader structural uptrend has not been challenged. This kind of pullback would represent ordinary mean reversion within an ongoing bull market, rather than the start of any larger trend reversal.
Following any late-May low, my cycle work points to a strong rebound that should carry US Equities sharply higher into mid-to-late July and potentially extend into mid-August. Thus, while near-term caution looks warranted, I do not view this as a place to be aggressive on the short side — better to use any weakness over the next two weeks as an opportunity to rebuild long exposure ahead of the seasonal tailwind into the summer.
For now, it arguably remains premature to position aggressively short of US Equities ahead of these levels actually breaking. Momentum can carry prices further than expected in the short run, and the trend has not formally rolled over. However, the asymmetry of risk/reward has shifted, given Friday’s reversal patterns combined with the breadth deterioration occurring precisely on schedule.
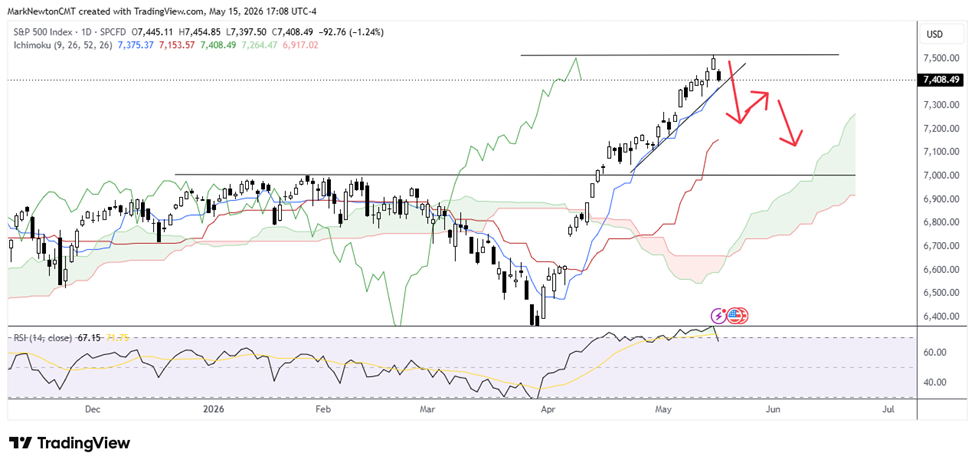
As shown below, ^SPX found resistance precisely one point above 7,500 into Thursday’s close before retreating on greater than 3:1 negative breadth on Friday. 10- and 30-year yields spiked up into resistance and will be key to watch heading into next week. Given that South Korea’s EWY will face selling requirements in Samsung and SK Hynix into late May, this represents another important piece of the puzzle to watch carefully. Under 173.60 in EWY likely could lead to selling pressure in US Technology next week.
If 7,375 is broken, my two downside targets are 7,151 and then an area from 7,002 up to 7,058. This latter zone is thought to be strong support for ^SPX on any near-term selloff.
S&P 500 Index (^SPX) – Friday’s bearish reversal raises the probability of a coming break of the recent uptrend line; ^SPX 7,375 is the key downside pivot
Global push higher in Treasury yields is the big macro development; near-term stall expected at resistance before a larger rally that could disrupt Equities
The most important macro development this past week has been the synchronized push higher in long-end Treasury yields, both in the US and across the broader developed world. US 10-year and 30-year yields have made progress higher, and the move has been mirrored across Germany, the UK, Japan, and other developed-world sovereign bond markets. This kind of synchronized move is meaningful technically, given that it suggests the move is structural rather than purely idiosyncratic to any one country.
The daily chart below shows what I feel is a five-wave advance from 5/7 into today’s close on 5/15, which has served as technical confirmation that yields should be starting a meaningful push higher in the months ahead.
However, given that this one-week Elliott-wave pattern is in its fifth wave, I’m doubtful that 4.60% is immediately exceeded in ^TNX.
Rather, a minor 23–38% pullback of the prior range should now occur over the next week. I expect that any minor backing and filling in yields should represent a chance to shorten duration, and a meaningful push back higher is imminent for US Treasury yields to join other countries’ yields in rallying to new annual highs.
This looks to be the most important technical development of the week and likely sets the tone for a coming breakout in long-term US Treasury yields.
CBOE 10-Year Treasury Yield (^TNX, daily) – Approaching near-term resistance; expect a minor stall and backing and filling before a larger rally develops
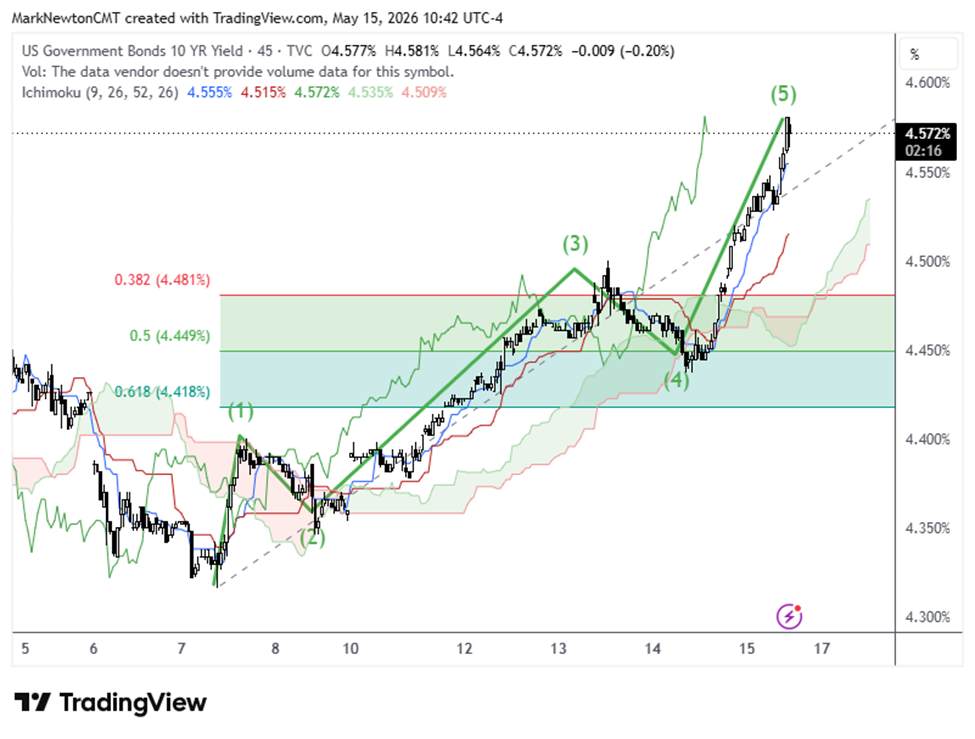
My expectation is that 10-year yields stall here near-term resistance and should undergo a period of minor backing and filling in the very short run. This sideways-to-lower consolidation is likely a counter-trend pause within a larger move higher. However, after this near-term digestion phase, I anticipate a much more substantial rally in yields getting underway over the coming months, and this is exactly the catalyst that could spook the Equity market and disrupt the broader rally, given what was witnessed in today’s session.
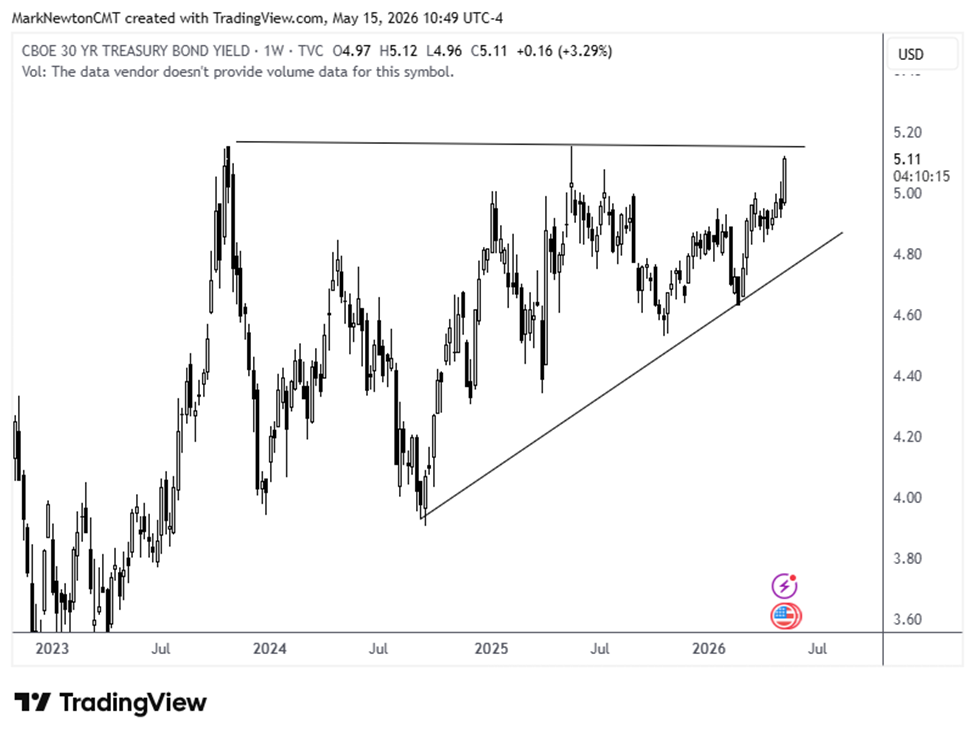
The US 30-year yield chart appears far more bullish than 2s, 5s, or 10s and has formed an ascending triangle pattern with resistance near 5.15% in 30-year Treasury yields.
While many feel 5.00% is an important level, this looks to be purely psychological, and 5.15% carries more importance, given it represented the intra-day peaks back in 2023.
A weekly close above this level would result in long-term yields beginning a larger spike higher. If Friday’s price action in Equities was any clue as to how Equities behave on a spike in yields, I suspect a breakout that causes yields to push higher more quickly would be a definite temporary negative.
Over the next week, a pullback down toward 5.00% would represent support for yields before the start of a larger push higher. Once yields definitively break 5.15% on a weekly close, it will be prudent to discuss upside targets in yield on both a price and time basis. At present, this week’s move is important and could have kicked off the start of a much larger move higher in yields.
CBOE 30-Year Treasury Yield (TYX, weekly) – Structural setup argues for a larger rally in long-end yields to come
Gold’s strength continues to look constructive while Crude consolidates near support pending Hormuz clarity
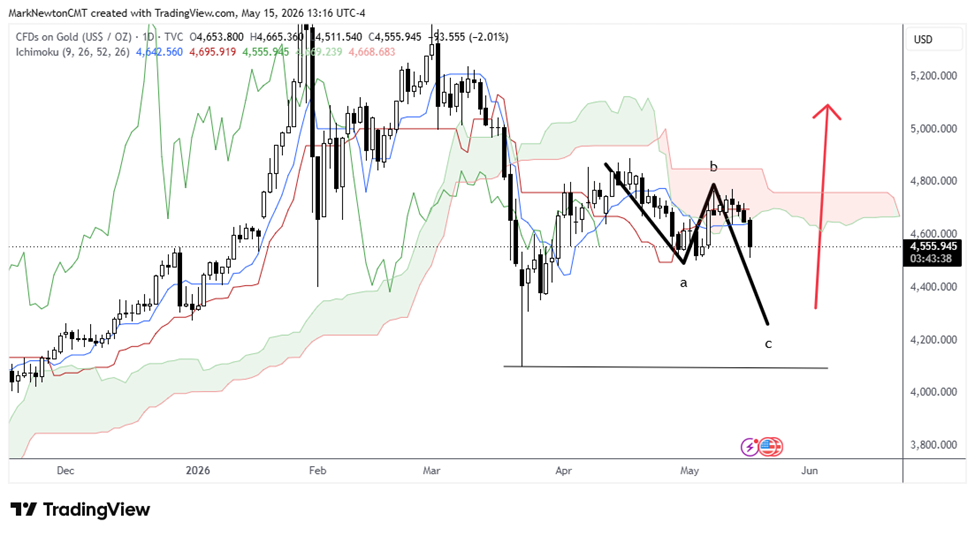
Gold’s daily chart shows a constructive technical structure that makes recent price weakness this week look like a buyable opportunity once early May lows are undercut.
Specifically, this near-term pattern does look to be a minor technical negative on a 3–5 day basis. Either 4,500 holds for Gold, or a break should lead to 4,300–4,400.
However, based solely on technical patterns from March, this selloff doesn’t likely represent the start of any meaningful decline, despite yields having started to push higher.
Rather, near-term weakness should translate into a dip-buying opportunity for a final 4–5 month rally back to new all-time high territory.
Gold’s behavior here is consistent with broader safe-haven demand picking up at the margin, and it lines up well with the cross-asset narrative of volatility starting to creep back into the picture given the global yield push higher.
Only if 4,100 is broken would this narrative change for the worse. Until then, dips should make Gold more appealing from a risk/reward perspective, and it looks right to buy dips.
Gold (Spot, daily) – Constructive technical structure remains intact; Gold continues to act well as a safe-haven proxy
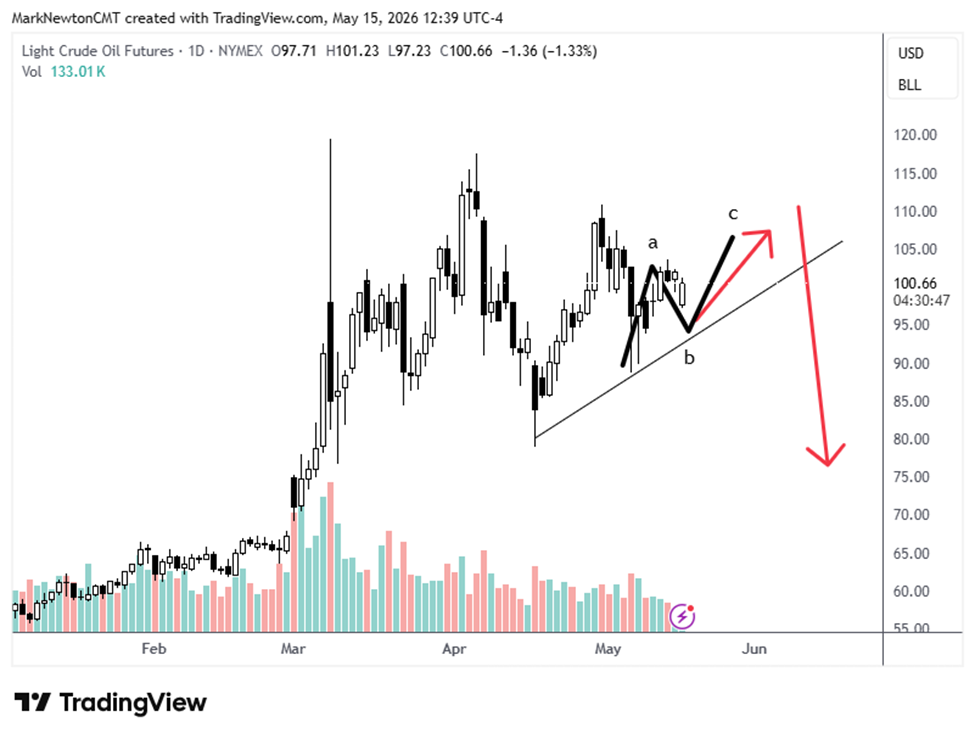
WTI Crude has consolidated near support but has not yet broken down as expected.
Technically, this doesn’t translate into a bullish 1–2 month thesis for Crude. Rather, gains should prove temporary before the start of a larger move to the downside.
As investors know, no formal Hormuz Strait resolution has yet emerged, and price action remains in a holding pattern pending clarity on the geopolitical front. As I have flagged in recent notes, my expectation is that any meaningful Hormuz opening would bring Crude lower and contribute to USD weakness — both of which would be broadly constructive for risk assets globally over the medium term. However, until such a resolution materializes, Crude is likely to chop within its near-term range, and the asymmetry remains skewed toward lower prices on any positive geopolitical headlines.
The one-week pattern for Crude looks a bit more constructive given the price action from early May. If my labeling is correct, there could be a final attempt to rally to test early May highs near $110 before the price starts to give way.
The real key lies in trendline support near $93–$95, depending on when this is broken. For now, price remains in a holding pattern but could experience minor strength over the next week. This likely translates into a deal still being premature and requiring more time. Equities very well could consolidate if/when Crude pushes higher. However, by the end of May, I anticipate that a downturn should occur for Crude, which should affect Equities positively.
WTI Crude Oil (CL_F) – Consolidating near support; a Hormuz opening would likely add downside pressure, though no resolution has yet materialized
Bottom Line
Friday’s session produced the first technical sign that US Equities could be attempting to peak within the 5/15–5/19 cyclical window I have been flagging. ^SPX 7,375 and QQQ 707.64 are the key support levels to watch — a daily close beneath these levels would confirm what I expect to be a three-wave Elliott-wave-style pullback of 3–5% into late May, before a strong rebound carries US Equities back higher into mid-to-late July and potentially into mid-August. The big macro catalyst to watch is the synchronized global push higher in Treasury yields — I expect a near-term stall and minor backing and filling at resistance, but the larger rally in yields I anticipate over the coming months looks to be the variable that could ultimately bring volatility back to risk assets. Gold continues to look constructive as a safe-haven proxy, while Crude consolidates near support pending Hormuz clarity. It’s important to emphasize that until support is broken — which might or might not happen next week — trends are positive for Equities and have not yet turned bearish. Yet, time seems to be running out, given the multiple signs of breadth deterioration coupled with rampant overbought conditions in Semiconductor stocks heading into NVDA earnings next week. Stay tuned.
______________________________
PS: If you are enjoying our service and its evidence-based approach, please leave us a positive 5-star review on Google reviews —> Click here.