


Daily Technical Strategy Video (1/23/26)

Upticks – Newton’s Law
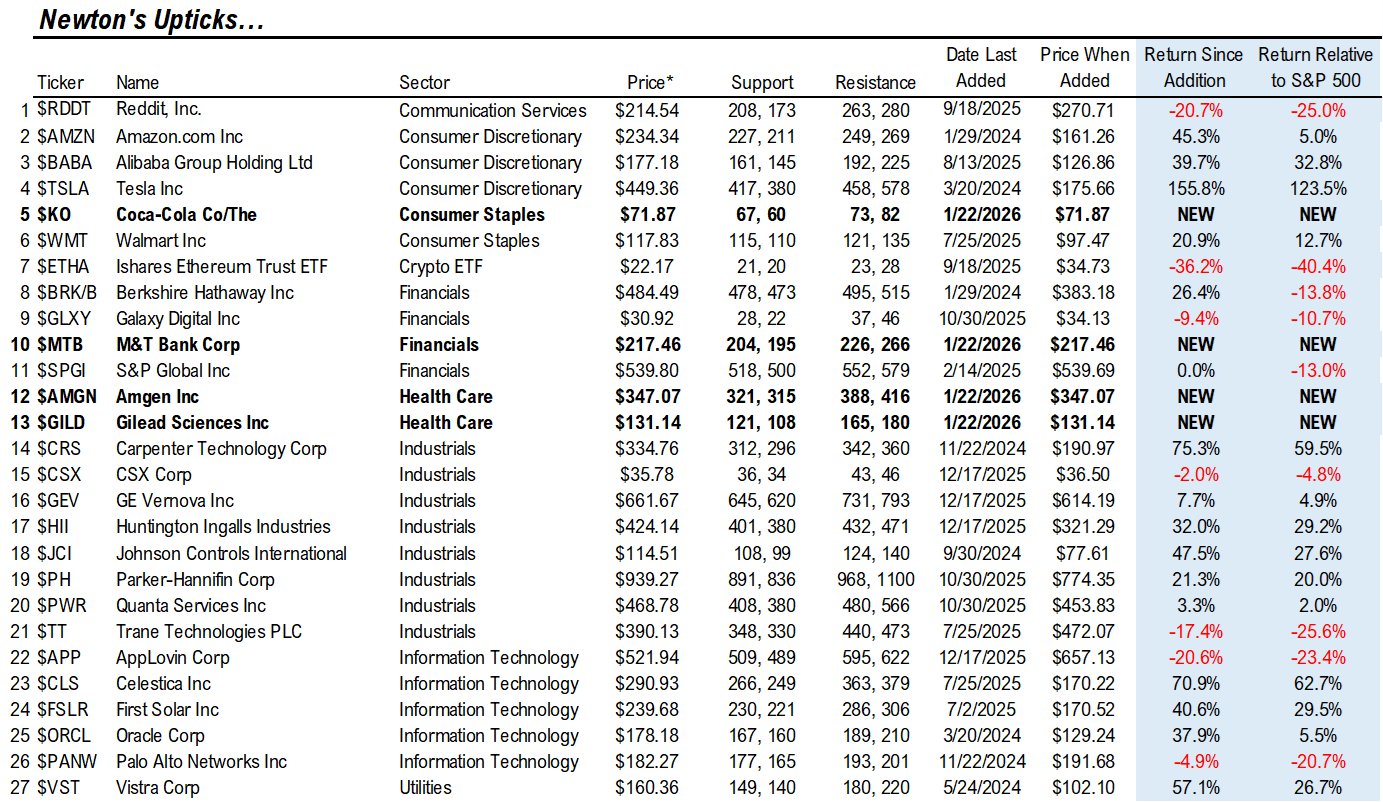
Upticks Additions
- M&T Bank (MTB -2.56% - $217.46)
- Amgen (AMGN 0.53% - $347.07)
- Gilead Sciences (GILD -0.83% - $131.14)
- Coca Cola (KO 0.03% - $71.87)
Upticks Deletions
- Ulta Beauty Inc. (ULTA -1.12% - $681.64)
- Cameco Corp. (CCJ -3.27% - $121.87)
- Robinhood Markets Inc. (HOOD -4.57% - $106.25)
- Shopify (SHOP -3.41% - $137.64)
- Seagate Technology Holdings (STX -3.96% - $346.53)
- Anglogold Ashanti Plc. (AU -1.25% - $103.05)
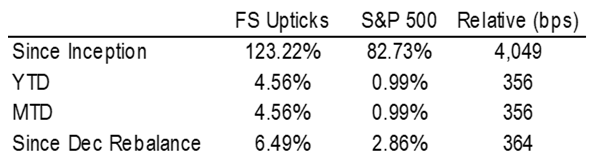
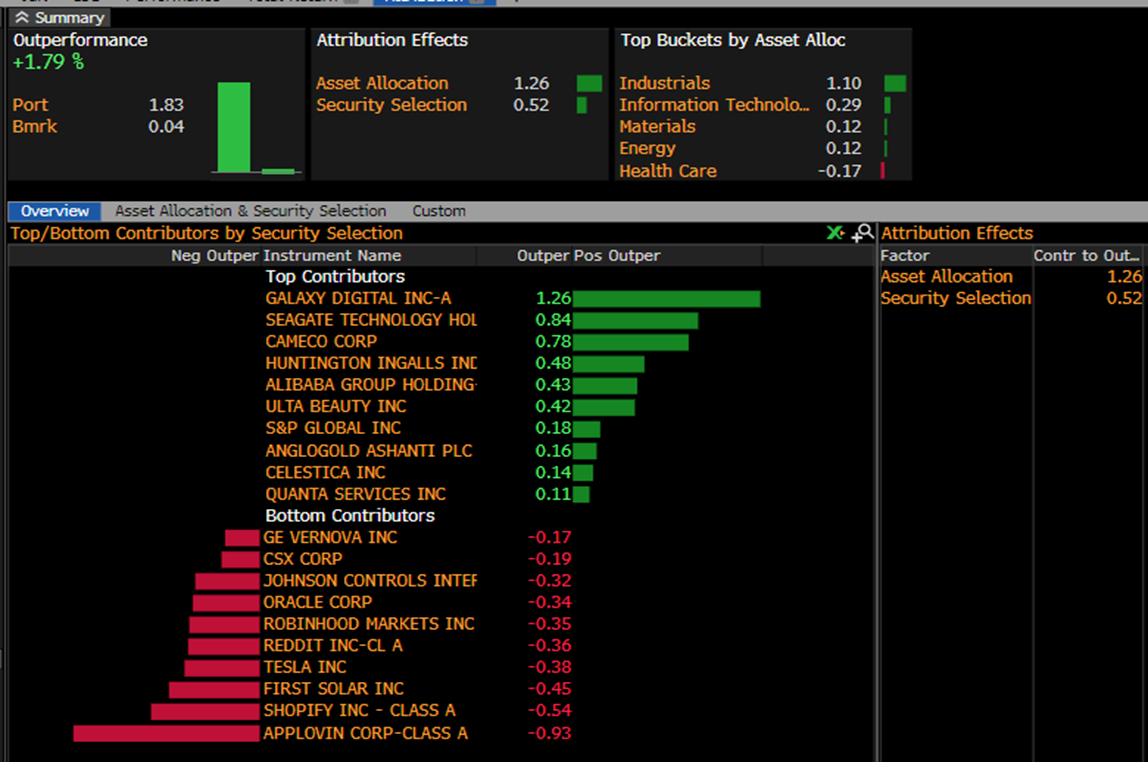
UPTICKS Total Return vs. SPY, Year to Date
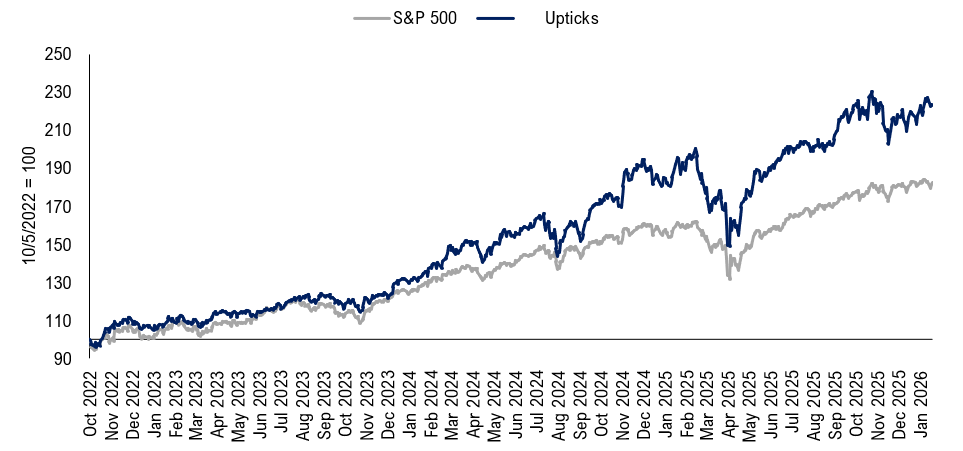
UPTICKS Return vs. S&P 500, Since Inception
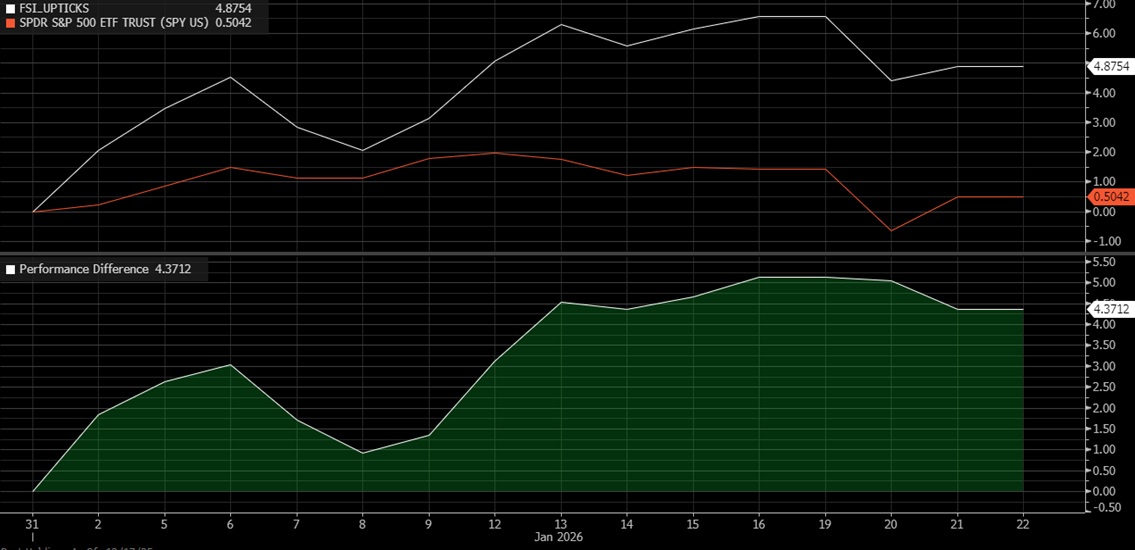
Upticks One Month Contribution to Performance Relative to SPY (December 22 to January 22)
Upticks Commentary
Below is a technical write-up of seven stocks for this month’s UPTICKS publication
(All prices reflect closing prices as of Thursday, 1/22/26.)
ADDITIONS: MTB -2.56% , AMGN 0.53% , GILD -0.83% , KO 0.03%
M&T Bank (MTB -2.56% - $217.46) Large base breakout awaits
Support $204, $195; Resistance $226, $266
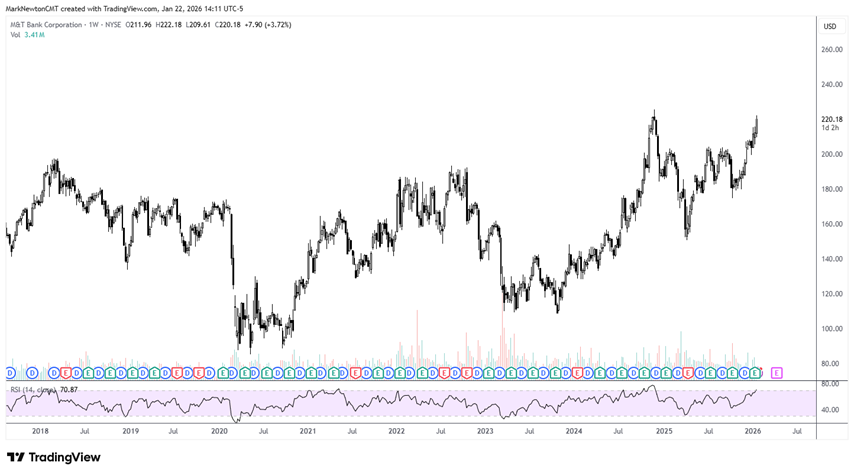
MTB -2.56% has begun to show attractive strength following its rally back from the consolidation breakout, which happened in late 2024
Its mammoth six-year base was surpassed in early 2025, and following some consolidation, the stock has just pushed back to within striking distance of all-time highs again.
A coming breakout is expected in February, and above $226 should help to carry MTB -2.56% eventually up to $266.
Technically, large multi-year base breakouts like these tend to be positive when an initial breakout undergoes consolidation before pushing up rapidly again. Overall, this looks quite promising to me technically at these levels.
Amgen- (AMGN 0.53% - $347.07) Push to new highs is considered after nearly a two-year breakout of its range since July 2024
Support- $321, $315; Resistance- $388, $416
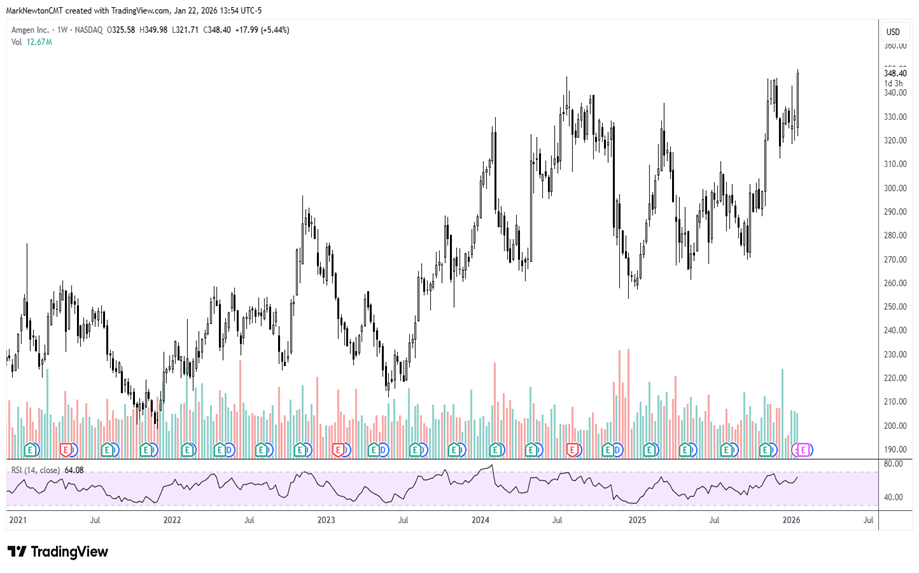
AMGN 0.53% ’s breakout of last November’s highs is part of a larger breakout extending back to July of 2024. This is very bullish technically and likely should drive this up to $388 and eventually to $416.
Biotechnology has made a big comeback in recent months, and the Equal-weighted Healthcare ETF (RSPH -1.59% ) just moved back to new all-time high territory.
I expect AMGN 0.53% to strengthen in the weeks to come following this week’s breakout, and the base breakout makes this technically appealing.
Gilead Sciences- (GILD -0.83% -$131.14) – Has just exceeded peaks going back since 2015 back to new all-time highs
Support- $121, $108; Resistance- $165, $180
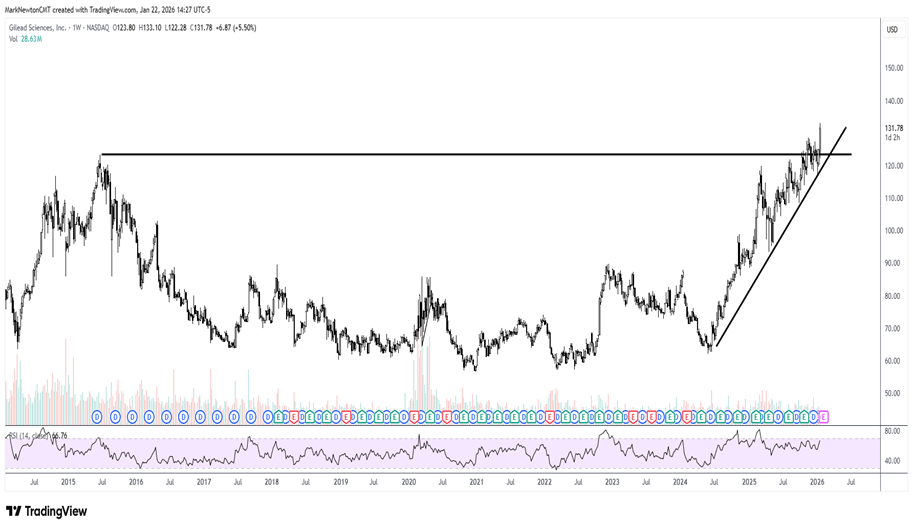
GILD -0.83% has just managed to follow through on the breakout back to new all-time high territory, which initially happened two months ago in late 2025.
The larger area of all-time highs last occurred back in 2015, making recent strength a very big positive following a massive decade-long sideways consolidation.
Normally, the act of breaking back out to new all-time highs following a large neutral, sideways pattern can help the stock show further strength in the months ahead.
Pullbacks look to have ample support near $121, then $108, but I suspect that this week’s breakout should help to lead GILD -0.83% up to $165 and eventually to $180.
Given Healthcare’s recent breakout back to new highs on an Equal-weighted basis, I like GILD -0.83% to show outperformance in the months ahead.
Coca Cola (KO 0.03% - $71.87) KO is readying for a breakout back to new all-time highs
Support- $67; $60; Resistance- $73, $82
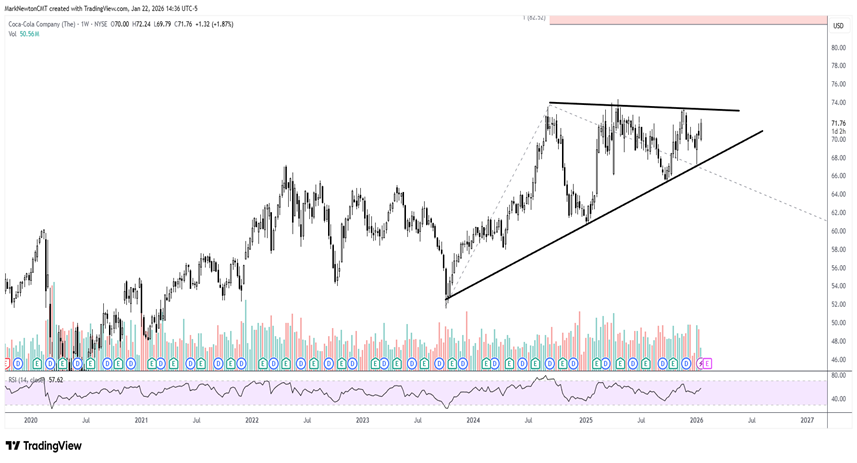
KO 0.03% remains one of the strongest stocks within the slumping Consumer Staples sector, and I suspect its lengthy triangle consolidation should yield to an upside breakout in the months ahead.
These types of ascending Triangle patterns with higher lows and a similar level of highs often can lead to upside acceleration once resolved, and KO 0.03% looks to be turning back higher to challenge its resistance hit most recently in late 2025.
Once KO 0.03% can achieve a weekly close above $73.23, I suspect it starts to trend up to $82 in the months ahead. Only a move back lower under $67 would serve to cancel the bullish stance.
Given the lengthy history of Consumer Staples underperformance, this looks to be one stock that could benefit on any evidence of “Staples” coming back to life.
Deletions: HOOD -4.57% , SHOP -3.41% , AU -1.25% , CCJ -3.27% , STX -3.96% , ULTA -1.12%
Below, I’ll share analysis on two of these, HOOD -4.57% and AU -1.25% , along with some additional analysis on a few that have underperformed but are remaining within UPTICKS: RDDT -3.70% and APP -1.77% .
(Robinhood Markets- HOOD -4.57% - $106.25) Trends and momentum remain bearish in the short run, which could lead to further near-term weakness into the Spring
Support- $102; $92; Resistance- $116, $130
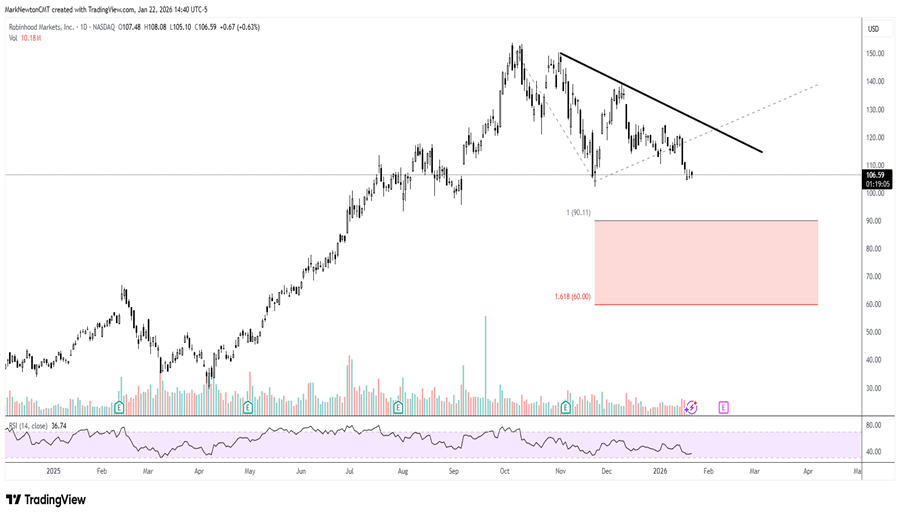
HOOD -4.57% ’s sharp downturn still looks early to produce an immediate bottom, and might weaken further in the months ahead, down near $92 before finding support.
Structurally, its decline unfolded from last Fall’s peaks initially as a three-wave decline. Thus, the bounce has now led to the second part of this corrective pullback, but might produce either a three-wave or five-wave pattern.
Both options above involve the stock likely pulling back further into this Spring. Thus, it makes sense to remove HOOD -4.57% at this time and simply revisit this once there’s ample evidence of this having bottomed.
Anglogold Ashanti PLC – (AU -1.25% - $103.05) Huge parabolic move likely will require consolidation in the months to come
Support- $78; $73; Resistance- $89, $95
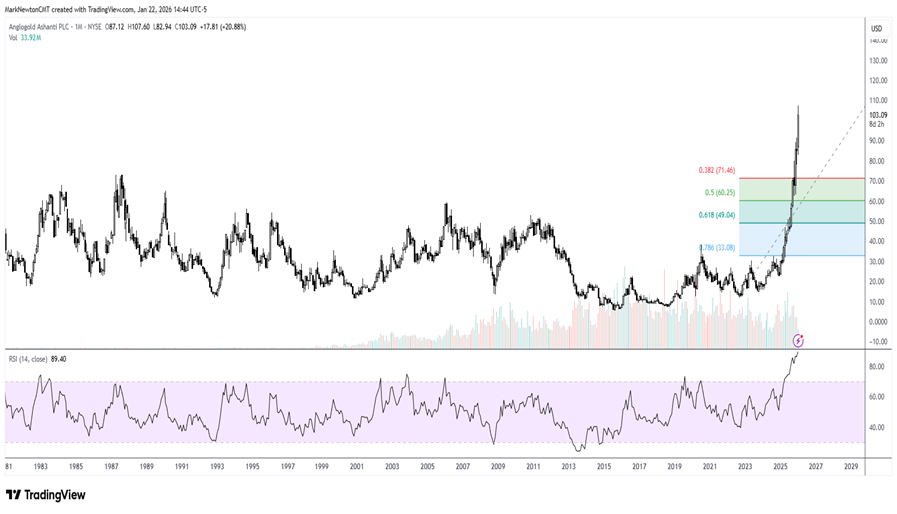
AU -1.25% has gotten parabolic in recent weeks, and its current momentum looks unsustainable.
Monthly momentum has reached the highest levels on record, and cycles for both Gold and Silver show an above-average chance of both peaking out by this Spring.
Given some of the counter-trend DeMark-based exhaustion signals that are starting to form on a weekly and monthly basis, it looks wise to consider using recent strength to take profits and simply look to buy dips in the months to come on weakness.
Therefore, I feel it’s right to remove AU -1.25% from UPTICKS as this list will not be updated again before my analysis shows this to likely peak out, technically. It will be right to monitor progress in the months to come, as the momentum in Gold and Silver stocks remains quite robust. However, at this time, AU -1.25% has gotten too overbought, and its risk/reward profile is not as favorable.
Some additional thoughts on a few stocks that look to be bottoming, which have underperformed but will remain within UPTICKS
AppLovin (APP -1.77% - $521.94) – APP -1.77% approaching 2025 lows, which have a good likelihood of holding at present
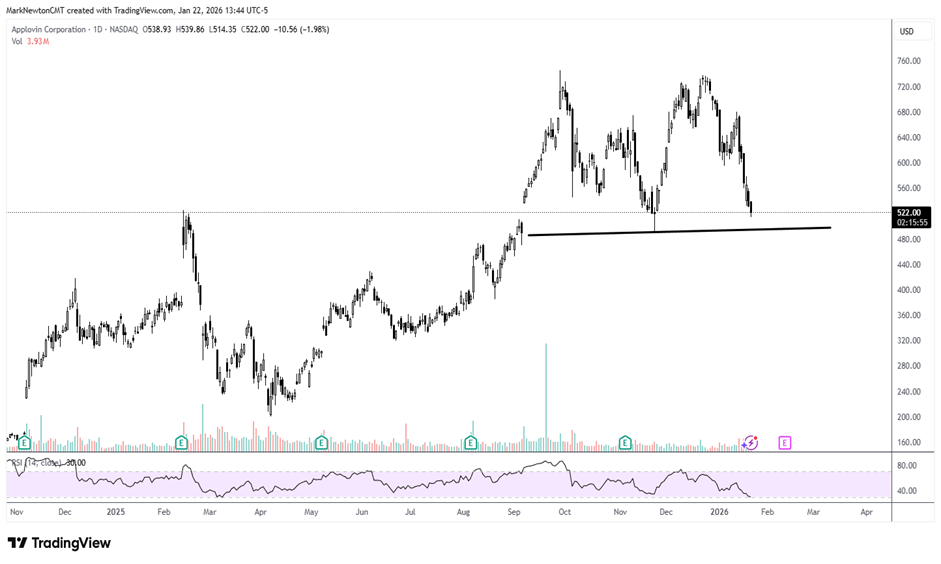
Unfortunately, APP -1.77% has experienced the same deterioration as many other stocks within the Software sector, which has resulted in near-term deterioration.
However, my analysis shows that the Software ETF from Ishares (IGV 0.26% ) should likely start to bottom out in the near future and begin trending higher. This might prove beneficial for stocks like APP.
As shown above, the stock has nearly reached prior lows from 2025 after its steep decline, and momentum (based on RSI readings) has neared oversold territory.
I expect that it’s right to keep APP -1.77% within UPTICKS at present, because it looks likely to stabilize near this former area of support and begin to bounce. It will be proper to monitor the degree of rally that this stock might experience in the next month or two, which will determine its prospects for the spring of 2026.
Reddit, Inc. (RDDT -3.70% - $214.54) – Recent weakness nearing intermediate-term support
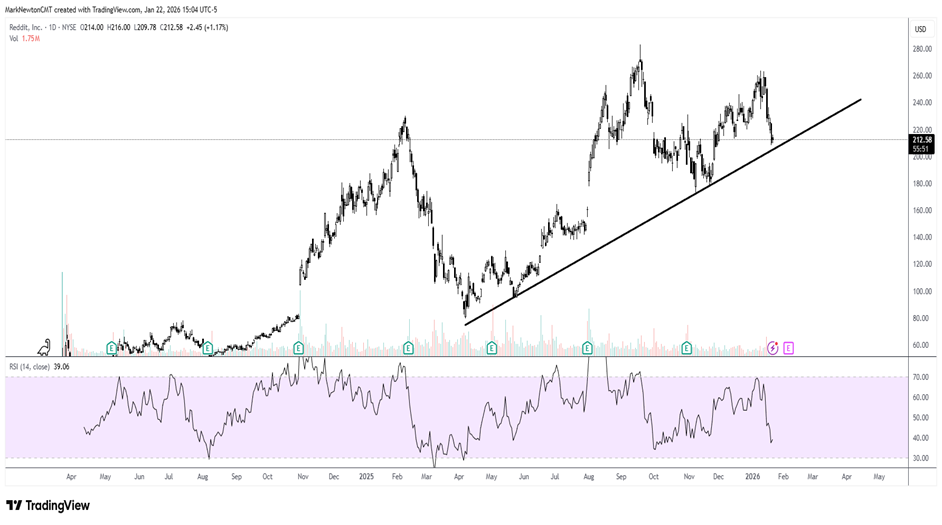
My thinking on RDDT -3.70% is quite similar to my thinking on APP -1.77% , mentioned above. RDDT -3.70% has proven weaker than expected lately, but now has pulled back to an area of likely technical support.
As shown above, the stock is nearing an area of an intermediate-term uptrend formed in spring 2025. Therefore, my expectation is that this trend holds, and it’s right to hold RDDT -3.70% for a bounce over the next couple of months.
Key resistance for RDDT -3.70% now lies near $263 initially, the area near the peaks from early January. The ability to get above this would be favorable for this stock to push back to new all-time highs.
At present, RDDT -3.70% appears like a good risk/reward, and I expect some stabilization and a bounce in the weeks to come.


