


Note: As part of our transition from FS Insight to Fundstrat Direct, my notes will transition from tom.lee@fsinsight.com to tom.lee@fundstratdirect.com. Please add the new address to your contacts or safe sender list to ensure uninterrupted delivery. The research and insights you rely on will remain exactly the same — only our name and sender address are changing. If you have questions, please visit our FAQ here.
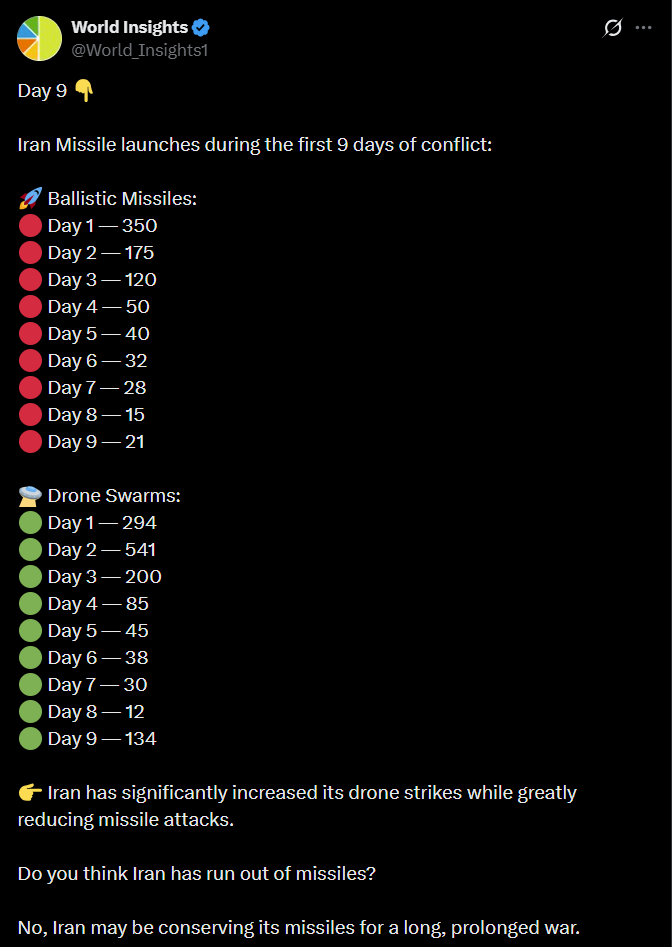
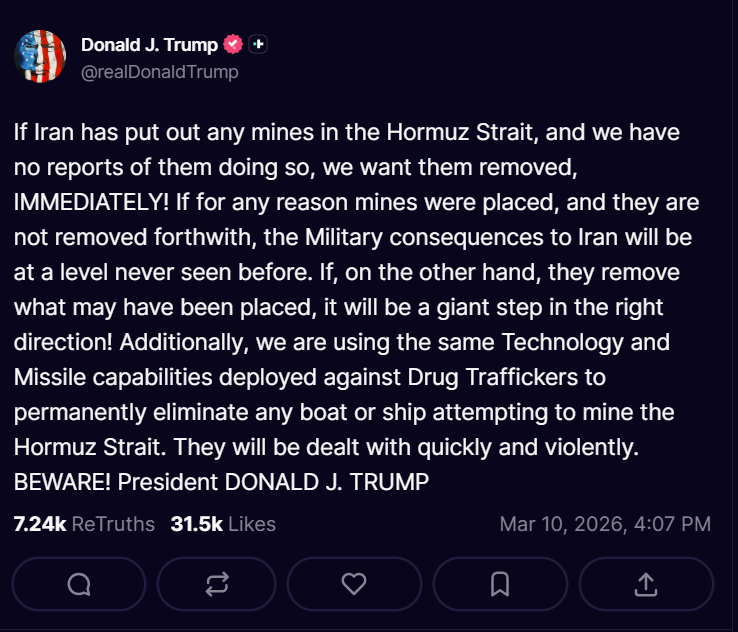
The US attack on Iran is now in its 10th day and since then, the S&P 500 is down -1.4%. To us, the conflict is likely longer than consensus expectations (which is a short war) and perhaps the best leading indicator is prediction markets, which see a 76% probability of $100 oil in June. In other words, that the conflict likely lasts through the next 3 months.
- Despite the view that this conflict is not “short” but likely extended, we still expect March to be an up month. We have highlighted, in the past, that stocks tend to rally after war commences — the adage, “sell the build up, buy the war” has mostly held true in last 8 major conflicts (6 of 8).
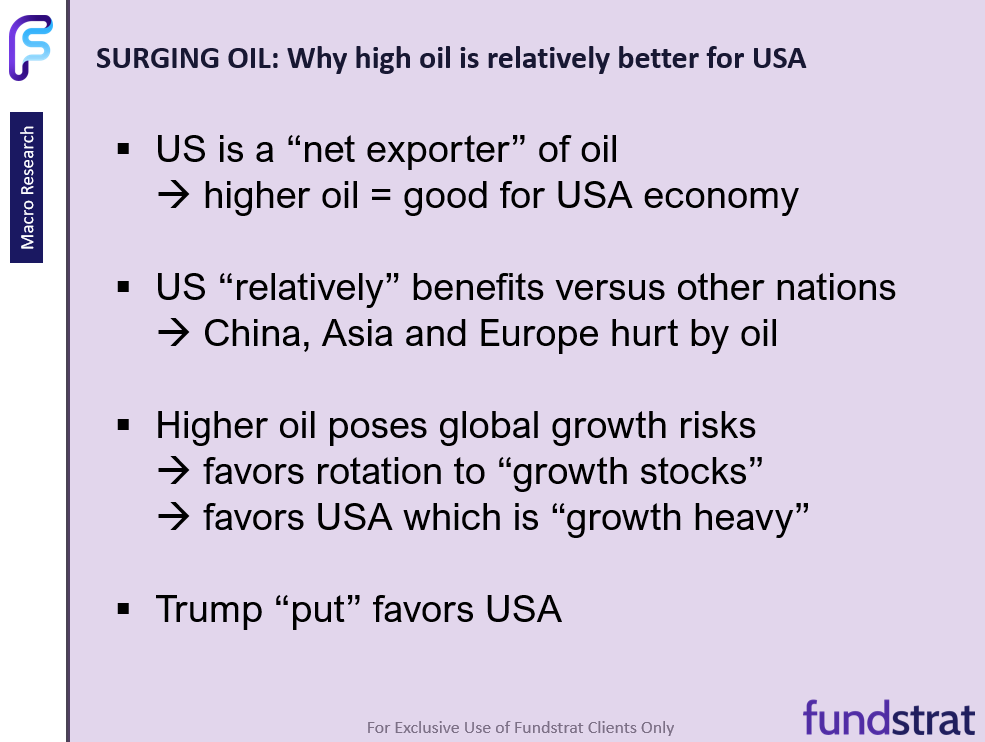
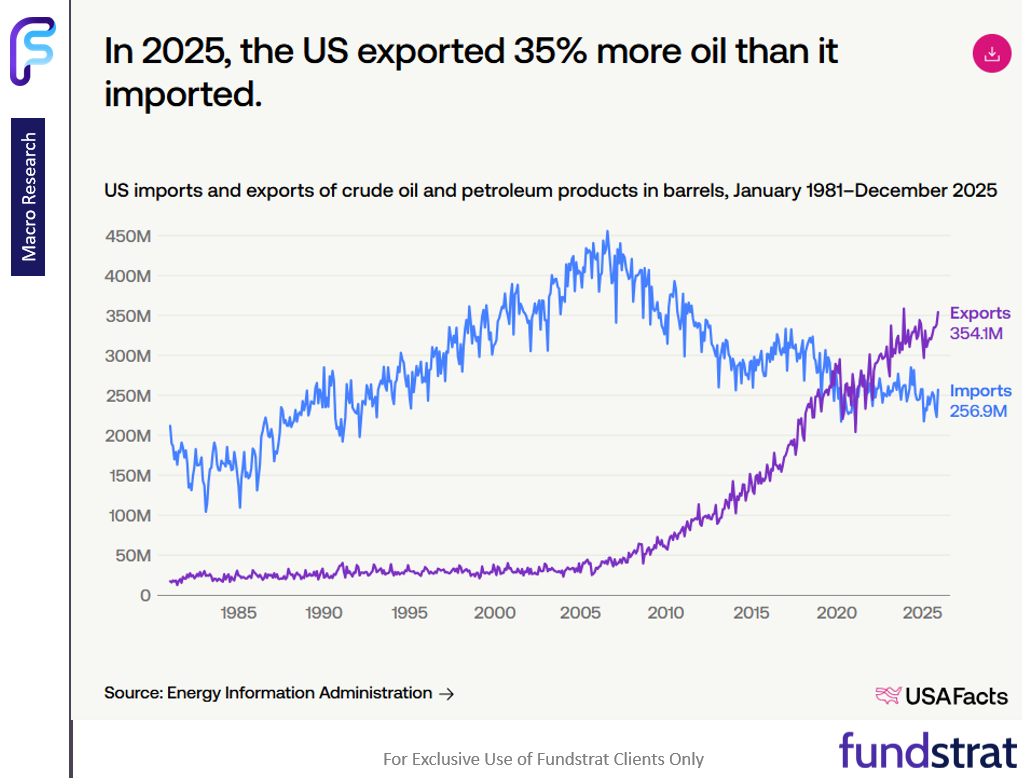
- Higher oil prices are the major impact of this conflict. And, in our view, the US is a net beneficiary of higher oil prices. There are 4 reasons for this:
– US is a “net exporter” of oil since 2020, hence higher oil = boost to economy
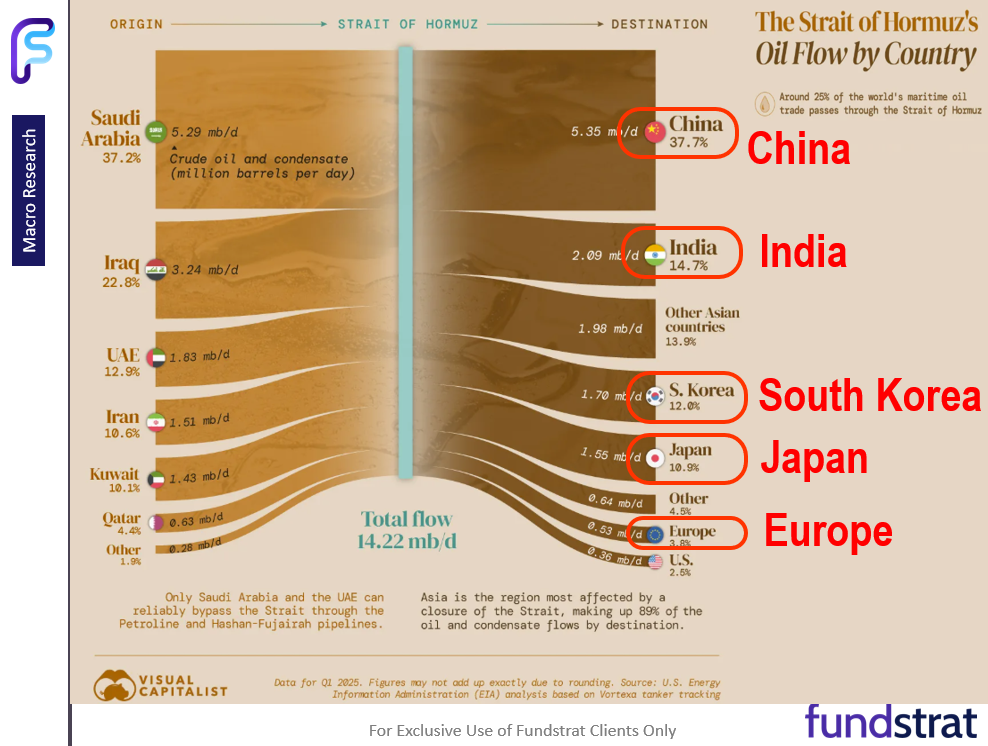
– US “relatively” benefits versus other nations as China, Asia and Europe are most hurt by closure of Straits of Hormuz
– Global growth likely slows, which means investors will favor growth stocks, and the S&P 500 is basically a growth index
– finally, the US has the Trump “put” - Since the war started, this view is bearing out. Since the war started, Europe is down -6%, Japan -7%, Kospi -11% while the S&P 500 is -1.4%:
– MAG7 is up +1%, outperforming by 240bp MAGS -1.12%
– Crypto Ethereum and Bitcoin are up +6.1% and 6.8%, outperforming by 750bp and 820bp
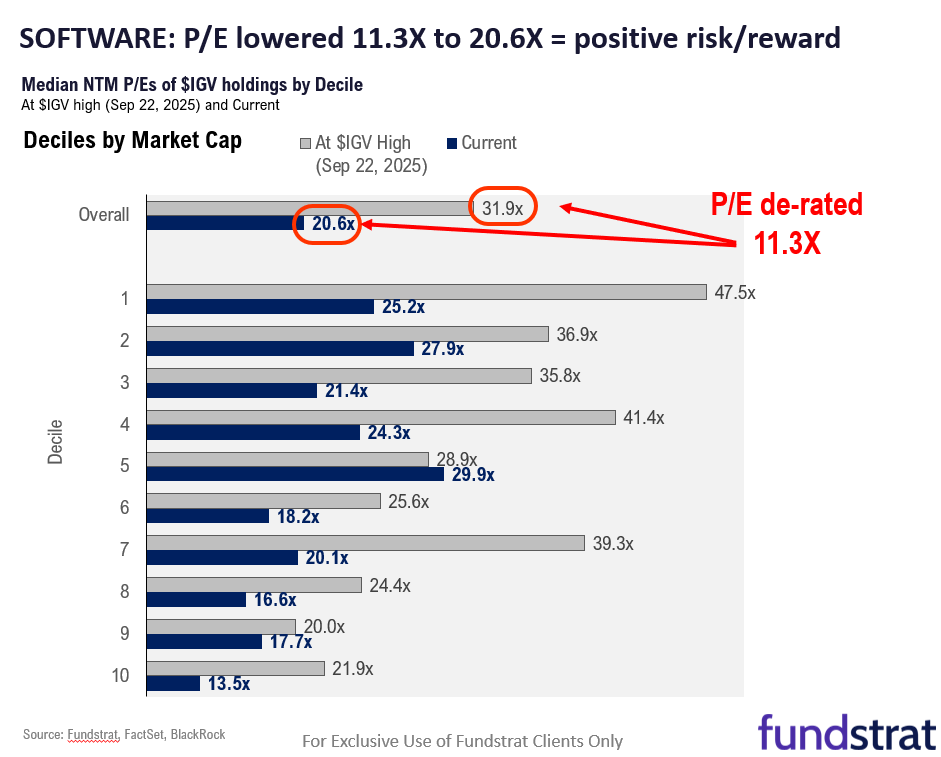
– ETHA -2.00% BITB -1.17% - Software stocks, in our view, have also bottomed. Consider the ETF IGV IGV 0.14% is now trading at 20.6X NTM P/E, compared to 31.9X 6 months ago. Basically, investors are valuing software like a cyclical group now, instead of as durable businesses with recurring revenue and low capex. This lower P/E might reflect uncertainty, but to us, reflects good risk/reward.
- Oracle reported results Tuesday evening and growth remains strong. And the stock is up 9% after hours. So to us, the positive reaction shows investor expectations are very low in software at the moment.
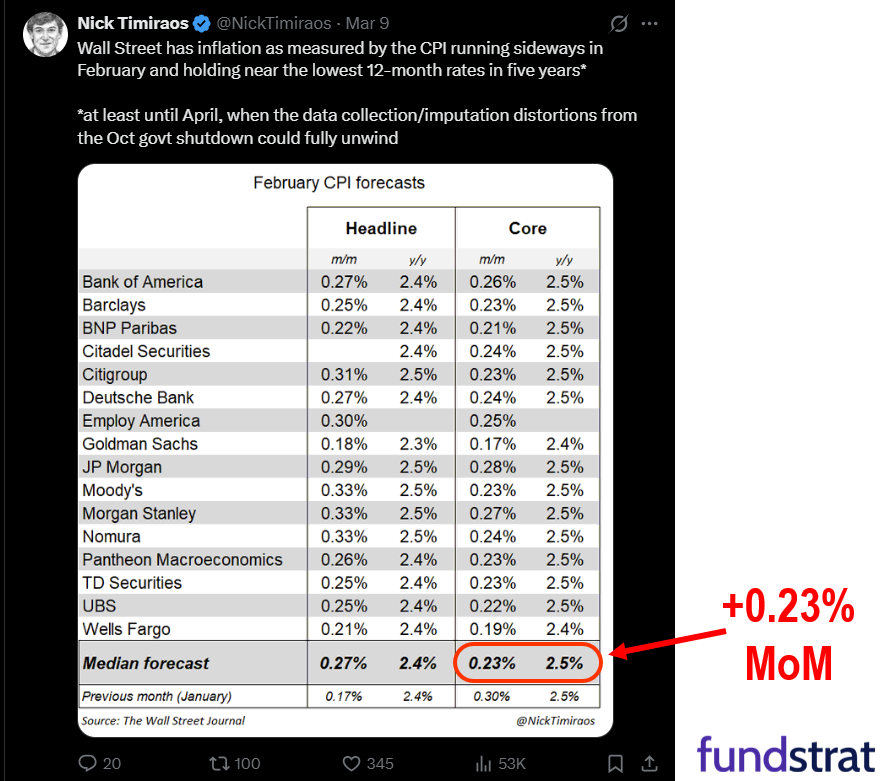
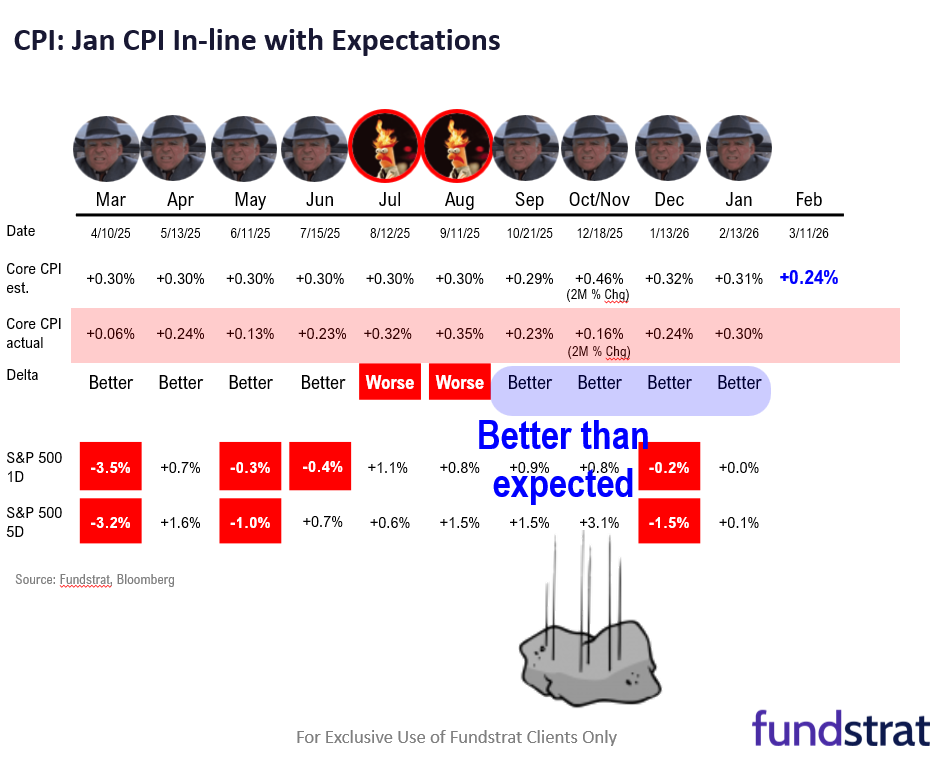
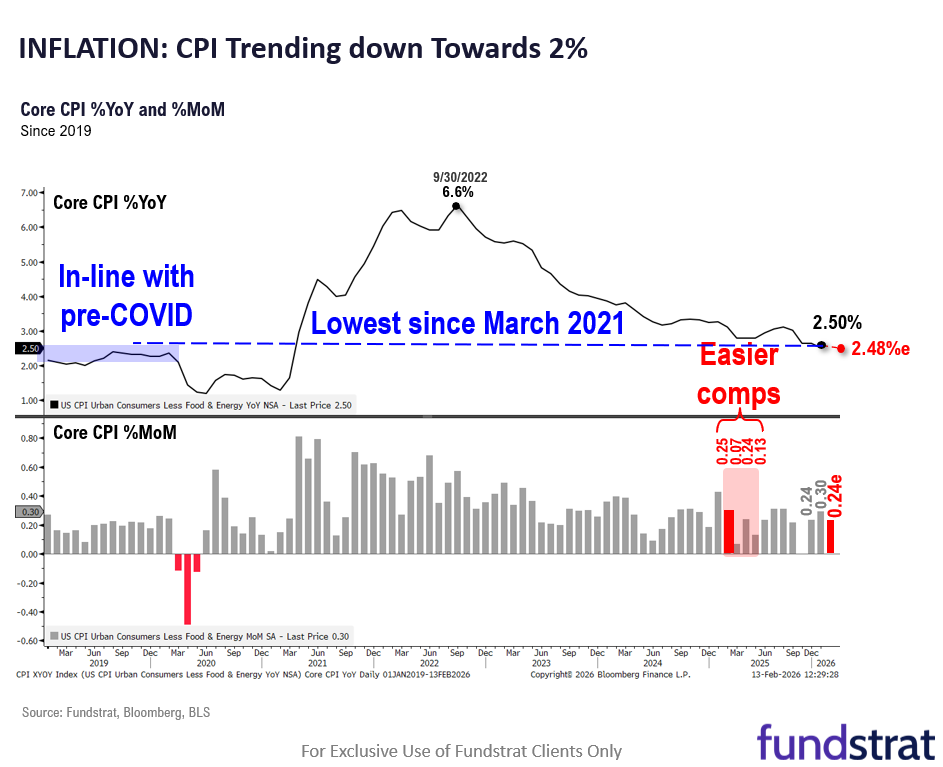
- February CPI is report on Wed am. The Street may not be entirely focused on inflation reports, but the trend in core inflation is positive. Higher oil will filter into core inflation eventually, but the Fed tends to care more about inflation expectations. And by the way, the Trump put is somewhat at play here. Higher gasoline is not popular and the midterm elections will have sway. So, this favors a shorter conflict.
- This Week there are important inflation releases including the Feb CPI on Tuesday and the Jan PCE on Friday:
– 3/9 Mon 11:00 AM ET: Feb NY Fed 1yr Inf Exp 3.0% vs 3.1%e
– 3/10 Tue 6:00 AM ET: Feb Small Business Optimism Survey 98.8 vs 99.6e
– 3/10 Tue 10:00 AM ET: Feb Existing Home Sales 4.1m vs 3.9me
– 3/11 Wed 8:30 AM ET: Feb Core CPI MoM 0.24%e
– 3/12 Thu 8:30 AM ET: Jan Trade Balance -66be
– 3/13 Fri 8:30 AM ET: Jan Core PCE MoM 0.37%e
– 3/13 Fri 8:30 AM ET: 4Q S GDP QoQ 1.4%e
– 3/13 Fri 8:30 AM ET: Jan P Durable Goods Orders MoM 1.2%e
– 3/13 Fri 10:00 AM ET: Mar P U. Mich. 1yr Inf Exp 3.7%e
– 3/13 Fri 10:00 AM ET: Jan JOLTS Job Openings 6750ke
BOTTOM LINE: AI rotation to “bullet makers” is not end of MAG7
We continue to expect March to be an up month. Markets are climbing a wall of worry. And we find investors skeptical of the possibility of upside given the risks of war. We continue to view 2026 as an overall tougher year for markets, with a 3 phase market (rally, then large decline, then YE strong). And our positioning remains:
- Energy/Basic Materials -> top pick
- MAG7 & Bitcoin & Ethereum
- Industrials -> “bullet makers”
- Financials: Large-cap and regional banks
- Small-caps


Part I: 41 Large-cap Core Ideas: Updated list is below
Large-Cap Core Stock Ideas are large-cap stocks that appear in multiple of our investment strategies.
- Consider these the stocks our top stock picks and thus, the higher quality ideas.

The Current Large-cap Core List as of 2/19/2026 is as follows (new additions in Bold):
Communication Services: GOOGL -0.18% , META -1.45% , NFLX -3.09% , SATS 1.10%
Consumer Discretionary: AMZN -0.53% , TJX 1.18% , TSLA -3.10%
Consumer Staples: COST -0.51% , MNST -0.47%
Energy: CVX 1.34% , OKE 2.55% , TPL 0.46%
Financials: AXP 0.18% , BK 0.21% , GS 0.50% , HOOD -1.07% , JPM 0.08% , PNC 0.44%
Health Care: AMGN -0.44%
Industrials: CAT -0.72% , DE -0.60% , ETN -0.09% , GE -3.31% , GEV 2.20% , NOC -1.47% , PWR 1.04% , UNP -1.01%
Information Technology: AAPL -0.39% , AMD 3.00% , ANET 0.14% , AVGO 1.30% , CDNS -0.77% , KLAC 1.82% , MSFT -0.65% , MSTR -1.86% , NVDA -0.98% , PLTR 1.90%
Materials: APD 0.97% , PKG -2.40% , PPG -2.38%
Utilities: VST -1.65%
Part II: 59 SMID Core Ideas: Updated list is below
SMID Core Ideas are small and mid-cap stocks that appear in multiple of our investment strategies.
- We believe SMID Core List could benefit from the multiple themes and secular tailwinds.

The Current SMID Core List as of 2/19/2026 is as follows (new additions in Bold):
Communication Services: RDDT -3.27% , SATS 1.10%
Consumer Discretionary: DPZ -0.43% , H -1.95% , IBP -1.61% , SGI -1.92% , SN -0.71%
Consumer Staples: ELF 4.39%
Energy: CCJ -2.56% , DINO 0.95% , DTM 3.27% , UUUU -3.90% , WFRD 1.19%
Financials: ALLY 1.33% , EWBC 1.33% , GLXY -4.54% , SOFI -0.57% , WAL 0.97%
Health Care: EXEL N/A% , HALO -0.60% , UHS -1.24% , UTHR -0.63%
Industrials: ARRY 1.60% , AVAV -2.02% , AWI -2.69% , BE 6.59% , BWXT 0.55% , CARR 2.36% , CRS -2.40% , CW 0.10% , DCI 0.08% , DY 0.97% , ENS 2.77% , FIX 1.52% , HII -2.24% , IESC 2.96% , ITT 1.79% , KTOS -1.02% , MLI -0.47% , NXT 2.91% , RKLB 3.53% , STRL 2.50% , VMI -1.15% , WTS -1.05%
Information Technology: FN 8.06% , IONQ -1.24% , LSCC 0.81% , LITE 10.18% , MDB 0.20% , NBIS 2.48% , ON -1.44% , PATH -1.69% , PSTG 1.65% , RIOT 0.07% , SANM 4.16%
Materials: ALB -1.55% , MP -7.65% , RGLD -7.20%
Utilities: TLN 0.43%


Key Incoming Data March:
3/2 9:45 AM ET: Feb F S&P Global Manufacturing PMITame3/2 10:00 AM ET: Feb ISM Manufacturing PMITame3/4 9:45 AM ET: Feb F S&P Global Services PMITame3/4 10:00 AM ET: Feb ISM Services PMIHot3/4 2:00 PM ET: Fed Releases Beige BookTame3/5 8:30 AM ET: 4Q P Unit Labor CostsTame3/5 8:30 AM ET: 4Q P Nonfarm Productivity QoQTame3/6 8:30 AM ET: Feb Non-farm PayrollsMixed3/6 8:30 AM ET: Jan Retail SalesTame3/9 11:00 AM ET: Feb NYFed 1yr Inf ExpTame3/10 6:00 AM ET: Feb Small Business Optimism SurveyTame3/10 10:00 AM ET: Feb Existing Home SalesTame- 3/11 8:30 AM ET: Feb Core CPI MoM
- 3/12 8:30 AM ET: Jan Trade Balance
- 3/13 8:30 AM ET: 4Q S GDP QoQ
- 3/13 8:30 AM ET: Jan P Durable Goods Orders MoM
- 3/13 8:30 AM ET: Jan Core PCE MoM
- 3/13 10:00 AM ET: Jan JOLTS Job Openings
- 3/13 10:00 AM ET: Mar P U. Mich. 1yr Inf Exp
- 3/16 8:30 AM ET: Mar Empire Manufacturing Survey
- 3/16 10:00 AM ET: Mar NAHB Housing Market Index
- 3/18 8:30 AM ET: Feb Core PPI MoM
- 3/18 10:00 AM ET: Jan F Durable Goods Orders MoM
- 3/18 2:00 PM ET: Mar FOMC Decision
- 3/18 4:00 PM ET: Jan Net TIC Flows
- 3/19 8:30 AM ET: Mar Philly Fed Business Outlook
- 3/19 10:00 AM ET: Jan New Home Sales
- 3/23 8:30 AM ET: Feb Chicago Fed Nat Activity Index
- 3/24 8:30 AM ET: 4Q F Unit Labor Costs
- 3/24 8:30 AM ET: 4Q F Nonfarm Productivity QoQ
- 3/24 9:45 AM ET: Mar P S&P Global Services PMI
- 3/24 9:45 AM ET: Mar P S&P Global Manufacturing PMI
- 3/24 10:00 AM ET: Mar Richmond Fed Manufacturing Survey
- 3/26 11:00 AM ET: Mar Kansas City Fed Manufacturing Survey
- 3/27 10:00 AM ET: Mar F U. Mich. 1yr Inf Exp
- 3/30 10:30 AM ET: Mar Dallas Fed Manuf. Activity Survey
- 3/31 9:00 AM ET: Jan S&P Cotality CS 20-City MoM SA
- 3/31 10:00 AM ET: Feb JOLTS Job Openings
- 3/31 10:00 AM ET: Mar Conference Board Consumer Confidence
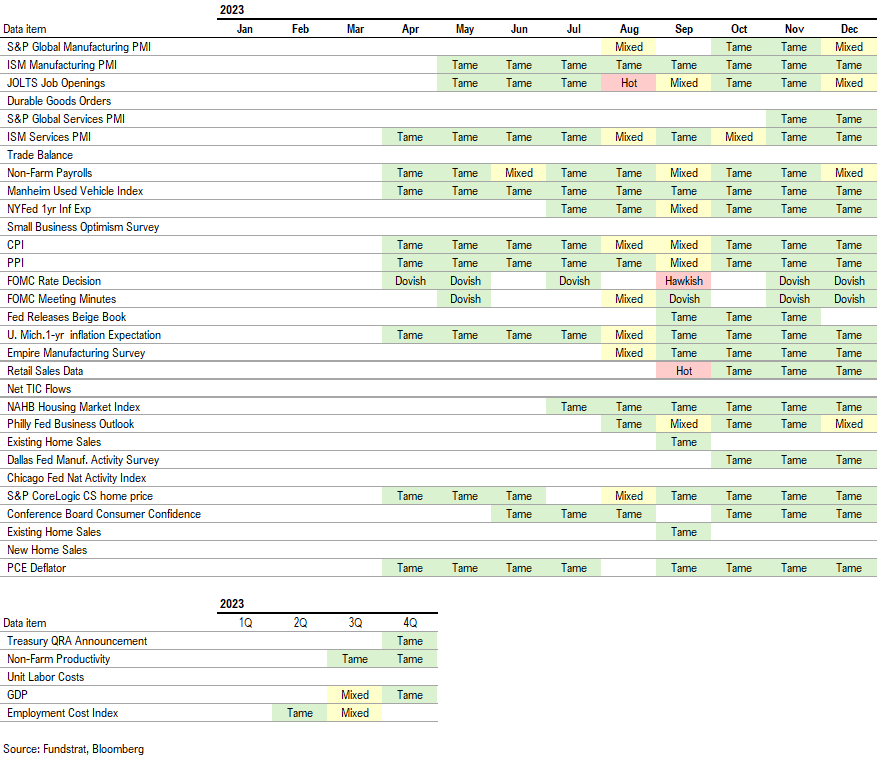
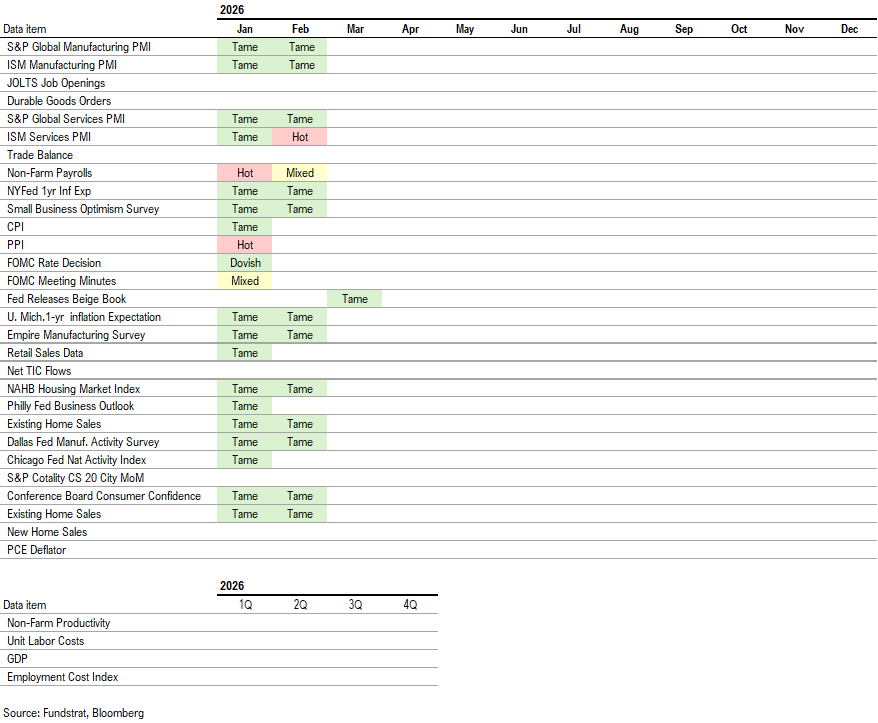
Economic Data Performance Tracker 2026:
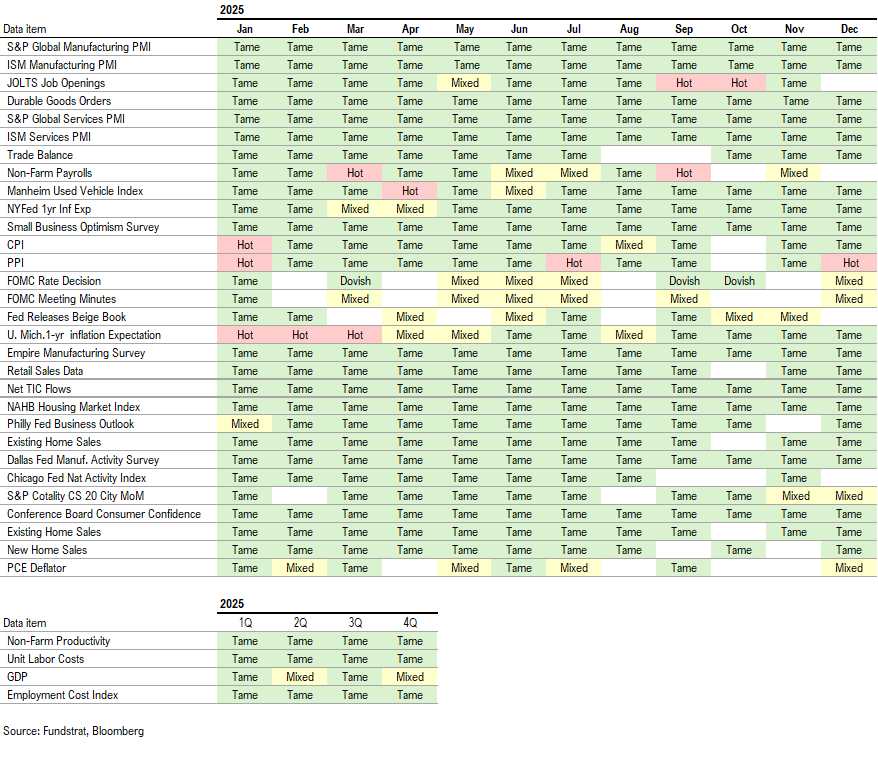
Economic Data Performance Tracker 2025:
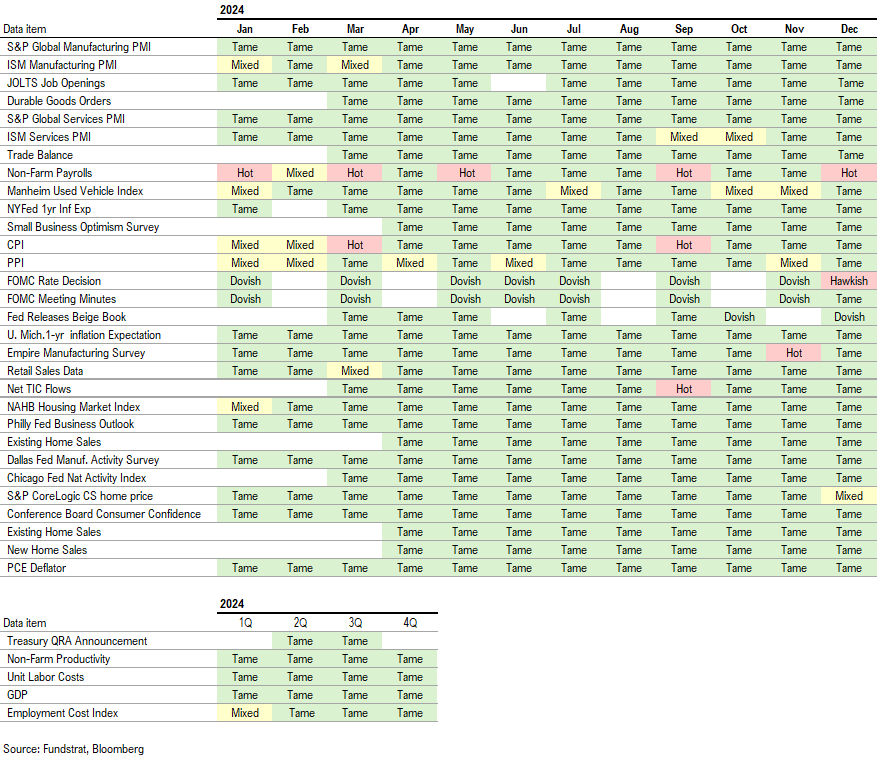
Economic Data Performance Tracker 2024:
Economic Data Performance Tracker 2023: