Nasdaq Composite Enters Correction Territory Due to 'Fog of War'

The “fog of war,” as characterized by Fundstrat Head of Research Tom Lee, took the stock market on a wild ride this week.

The S&P 500 lost 2.1% this week to 6,368.85 points, down for five straight weeks, marking the longest losing streak since the seven-week long stretch ending in May 2022. The Nasdaq composite, meanwhile, entered correction territory, meaning that it has fallen 10% or more from a recent high. It was down 3.2% this week. This month, the S&P 500 is on track to decline 7.4%, its worst monthly performance since 2022. 

The week started off with high spirits after the president posted on Monday morning that he had a “very good and productive” conversation with Iran, reversing the declines noted by stock futures over the weekend from concerns about an amped-up war. And it didn’t matter to investors that Iran said it had no wind of such talks because at least it seemed like the president was considering an exit strategy. But as the week progressed, once again investors realized that it’s not so easy to exit the war. On Thursday, the president said he is pausing strikes to allow for negotiations. 

Though the whiplash is annoying, it’s a good reminder that the president cares about the stock market. “Today was a reminder that the Trump put comes into play,” Lee said on Monday. 

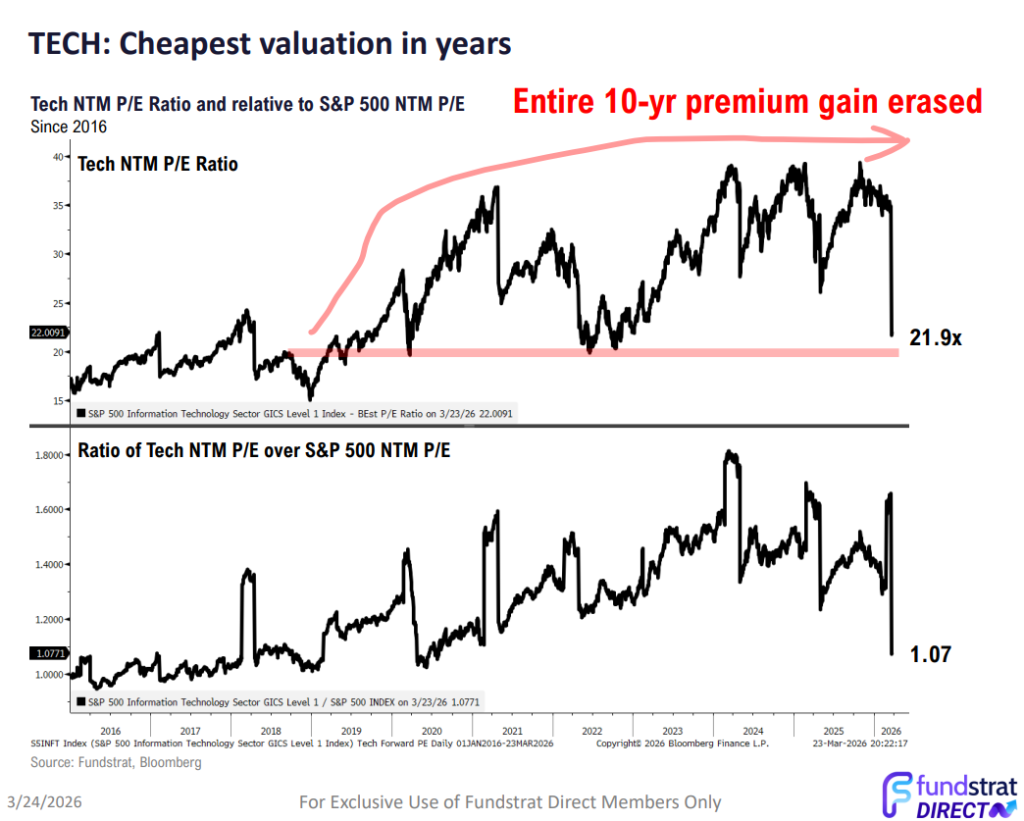
Lee highlighted that there’s still opportunities available in the market, despite all the red lately. Tech stocks, for example, are trading at valuations last seen a decade ago, he said. 

Head of Data Science “Tireless” Ken Xuan believes that the end of the war is near. One reason for that is because the president set a date of May 14-15 to meet with Chinese President Xi Jinping. 

Still, it’s becoming clearer that the impact on the energy markets from the war will take months to resolve. That means that the worry of higher oil prices feeding into inflation might remain a concern for longer than expected, which could change the calculus of the Federal Reserve’s next move. As it is, the Fed is struggling to balance its dual mandate of maximum employment and price stability. They will get a fresh look at the state of the labor market on Friday with the release of the March nonfarm payrolls report. 

Head of Technical Strategy Mark Newton is paying attention to the opposite signs in the market. He pointed out that expectations for where five-year interest rates would be in five years from now have declined, while 1-year break-even inflation rate has surged, suggesting that “the implication is that the Fed will come in to squash inflation by hiking.”

Newton also doesn’t believe that markets are through the worst of the sell-off, in apparent contrast to Xuan and Lee. “The bears certainly have cropped up, but the bullish levels are not really showing capitulation,” he said. “My thinking is we need to see some bulls capitulate, and that would be more indicative of a potential low.”

As for buying the dip, he’s still not convinced this is a good time. 

“I think we probably have one more shoe to drop, and if that happens in the next few weeks, I’d be inclined to say, ‘OK, hold your nose and buy,’” he said. “I think we’re getting close. I just don’t sense that we’re there just yet.”

 
Nasdaq Composite Enters Correction Territory Due to 'Fog of War'

Chart of the Week

Nasdaq Composite Enters Correction Territory Due to 'Fog of War'

“The entire premium that tech stocks have built up has been erased, and that to me, doesn’t make sense,” Fundstrat Head of Research Tom Lee said. “All this consistent earnings growth, increasing share of the economy, AI — all that’s been erased. I think that’s why the risk reward for tech is so good.” Our Chart of the Week shows the same. Lee recommends investors buy shares of the Magnificent Seven, which have been performing better than the broader market since the U.S.-Israeli strike on Iran. “AI rotation to ‘bullet makers’ is not the end of the Magnificent Seven,” he added. 

Recent ⚡ FlashInsights

NVDA -2.20%has pulled back to officially break $171 and while sitting near November lows, it’s thought that any violation of $171 represents a break of support going back since last September. Near-term, im not as bearish on NVDA getting below $160 right away, but do expect this might weaken to 165 before this can stabilize. This has a definite negative impact on the Semiconductor sector, and i mentioned last night that South Korea’s ETF (EWY +0.93%) had also broken support (which is very Technology heavy). Key for SMH -1.53%will be $374 but i view this decline in NVDA as being a negative development into next week if NVDA holds under $171 and given that its the largest stock within the ^SPX -1.77%at 8%, this is a notable headwind.
Mar 27 · 11:38 AM
90 minutes into trading, we’re seeing a decline of nearly 3/1 negative breadth as Technology breaks meaningful support. Semiconductor indices like SOX have pulled back to test support, but NVDA”s weakness under $171 represents a break of its consolidation and Software also is weakening by more than 2%. Tech Hardware to its credit, thanks to AAPL -1.80%is holding firm and has not broken down yet, but as this Equal-weighted sector chart shows of Technology ETF (RSPT -2.01%) price has broken down under prior lows which could cause additional underperformance in Technology in the weeks to come.
Mar 27 · 11:18 AM
QQQ -2.04%has now slipped under the lows from last Friday which puts this at the lowest levels since last September. DeMark indicators are early by about 8-10 days to show any kind of Exhaustion on daily charts, but could have an official TD Buy Setup as early as next week on this weakness. Overall, 575 looks like minor support which would represent an Equal-wave extension of 1/28-2/17 compared to 3/10 til present, but a stronger area of support lies near 567 and then 560. I expect that weakness down to 567 would represent pretty formidable support if reached by next week, but at present there’s not much between current levels $577.72 and $575 which might be hit by tomorrow.
Mar 26 · 1:42 PM

FS Insight Video: Weekly Highlight

Key incoming data

  • 3/24 8:30 AM ET: 4Q F Unit Labor Costs Tame
  • 3/24 8:30 AM ET: 4Q F Nonfarm Productivity QoQ Tame
  • 3/24 9:45 AM ET: Mar P S&P Global Services PMI Tame
  • 3/24 9:45 AM ET: Mar P S&P Global Manufacturing PMI Tame
  • 3/24 10:00 AM ET: Mar Richmond Fed Manufacturing Survey Tame
  • 3/26 11:00 AM ET: Mar Kansas City Fed Manufacturing Survey Tame
  • 3/27 10:00 AM ET: Mar F U. Mich. 1yr Inf Exp Tame
  • 3/30 10:30 AM ET: Mar Dallas Fed Manuf. Activity Survey
  • 3/31 9:00 AM ET: Jan S&P Cotality CS 20-City MoM SA
  • 3/31 10:00 AM ET: Feb JOLTS Job Openings
  • 3/31 10:00 AM ET: Mar Conference Board Consumer Confidence
  • 4/1 8:30 AM ET: Feb Retail Sales
  • 4/1 9:45 AM ET: Mar F S&P Global Manufacturing PMI
  • 4/1 10:00 AM ET: Mar ISM Manufacturing PMI
  • 4/2 8:30 AM ET: Feb Trade Balance
  • 4/3 8:30 AM ET: Mar Non-farm Payrolls
  • 4/3 9:45 AM ET: Mar F S&P Global Services PMI
Nasdaq Composite Enters Correction Territory Due to 'Fog of War'

Stock List Performance

Nasdaq Composite Enters Correction Territory Due to 'Fog of War'

In the News

Tom Lee: Nvidia at 19x PE. Is the Market Getting It Wrong?

Tom Lee: Nvidia at 19x PE. Is the Market Getting It Wrong?

logo image
Tom Lee: Supreme Court Ruling. What It Means for Investors

Tom Lee: Supreme Court Ruling. What It Means for Investors

logo image
AI wreaking havoc across software stocks, job losses might follow: Tom Lee

AI wreaking havoc across software stocks, job losses might follow: Tom Lee

logo image
More News Appearances

Disclosures (show)

Events

Trending tickers in our research