



Equity markets have remained range-bound over the last four months as part of underlying intermediate-term uptrends. While S&P in equal-weighted terms is far more bullish, the decline in Software and ‘Mag 7” has served as a headwind to both SPX and QQQ immediately joining suit at new highs. Underlying volatility across Equities has picked up measurably at a time when Defensive positioning has grown stronger in recent weeks, and this has caused investor sentiment to grow more pessimistic from levels that previously had become more bullish. The good news is that broader market breadth and Equal-weighted SPX have not broken down similarly to this time last year, nor in late 2021, which both preceded market selloffs. Thus, while Value remains preferred over Growth, and momentum is out of favor, there still look to be plenty of sectors that are working well. Overall, my bias is that early week Equity weakness likely stabilizes by Wednesday, and begins to turn higher in a rally between now and early March. Upside should be capped near 7150-7200, and I feel like it’s difficult having much conviction in US Equities compared to much of the world, barring some immediate stabilization and strength out of Technology.
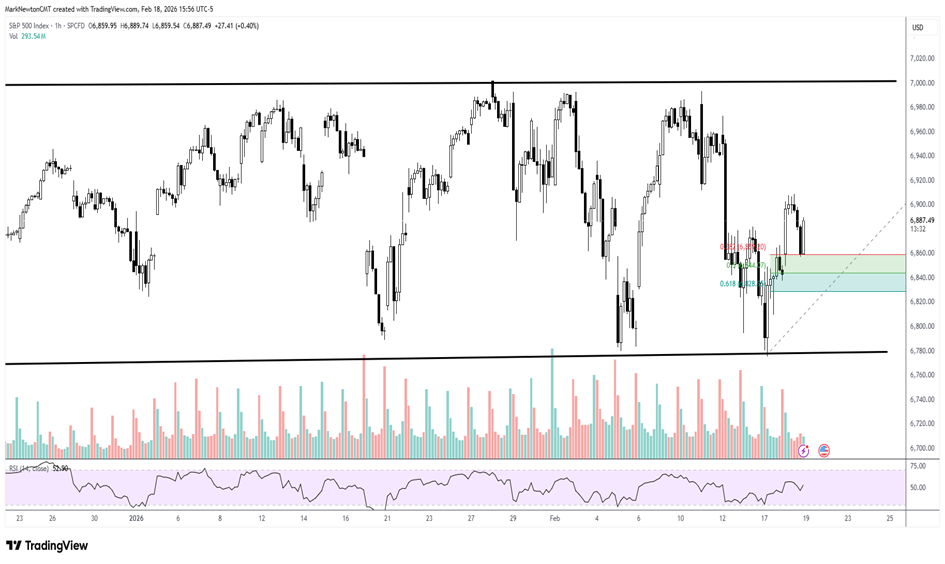
I am still expecting that a near-term trading low is being carved out, which should carry ^SPX higher into late February/early March. The only real change in message over the last few days is that a bit more confidence looks correct regarding the probability of a trading low being formed this week.
In the bigger picture, nothing has materially changed, which would alter the view of upside rallies likely proving limited to 3% higher before some type of selloff gets underway in the month of March. Much of this has to do with the degree of Technology and Financial weakness lately, and given the breakdown in “Mag 7” ETF by Roundhill (MAGS), this likely could cause a serious headwind barring some blowout earnings next week by NVDA.
As shown below, the extent of the move off Monday’s lows is now suggestive of a rally developing, which should carry ^SPX back to test and hit new all-time highs into late February/early March. Downside should be held between 6827-6858, while gains above 6909 likely carry ^SPX back to test and exceed 6993.
My upside target lies between 7150-7200, but should prove to be strong resistance for ^SPX.
S&P 500 Index
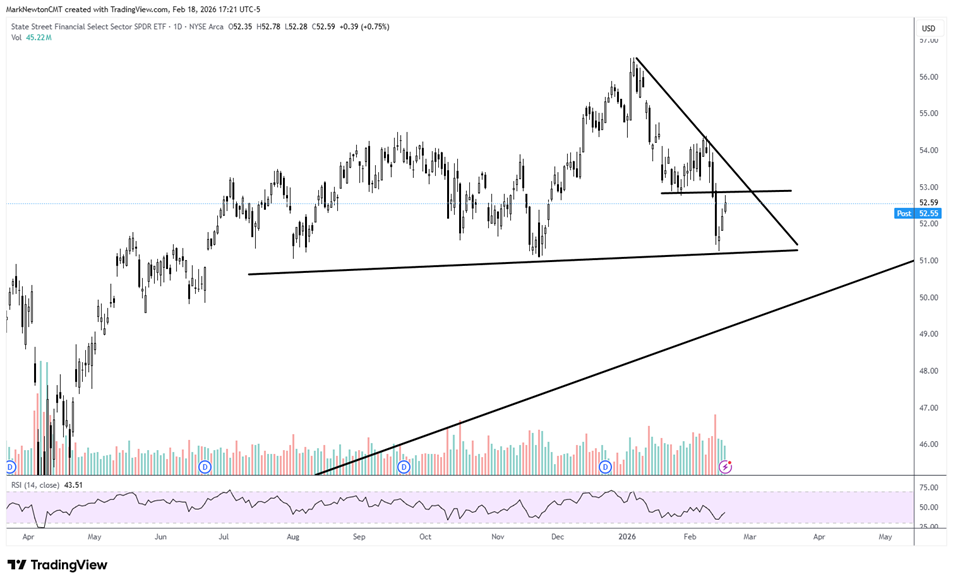
XLF holding support will prove important in the weeks ahead
Unfortunately, Financials have proven to be the worst of any of the major SPDR Sector ETFs Year-to-Date (YTD) with returns on the XLF of -3.98% through 2/18/26. This is worse than all other 10 sector ETFs that make up the S&P 500.
As shown below, the area near $51 is thought to be an important area of support, given that it held back in November 2025, as well as August 2025, and looks to have held this past Monday on a retest.
However, much work remains to be done before beginning to have more confidence in the possibility of a low on the horizon.
Initially, the prior swing low from 1/28/26 will need to be exceeded, which lies at $52.76. Recovering this level would be the first positive, followed by a move back above $53.65, which marks resistance coinciding with the downtrend from January peaks.
Relatively speaking, Financials still looks early to begin to outperform, but this absolute XLF chart is essential to keep handy in the event that the bounce turns out not to be as strong as desired.
Any downturn that violates $51 could postpone any recovery in Financials, which is important to the S&P 500, given that it represents the 3rd largest sector.
I expect that the next 1-2 weeks will help to shed some light as to whether a breakout in this sector can happen back above resistance, or whether this bounce should fail.
For now, the act of having held $51 is a constructive sign, technically speaking. However, now the more important job lies ahead.
For those investing in Financials, it still looks better to favor the Banks over the Investment broker-dealers, and the ratio of KBWB is expected to continue to outperform IAI (not shown)
As for attractive stocks within Financials, I favor MTB PNC GS CFG, JPM, BAC, along with STT, CBOE, and CME.
(Stocks like JPM need to hold $296, similar to $51 in XLF, this remains a very important area.)
State Street Financial Select Sector SPDR ETF
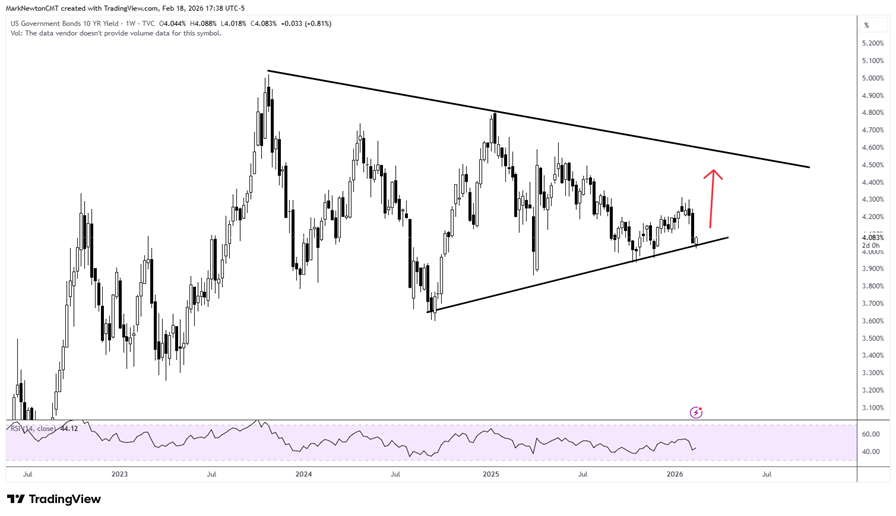
US 10-year Treasury yields likely push back higher as the yield curve starts to re-steepen
I think Thursday’s reversal in long-term bond yields is important technically, following the pullback to near key support (in yield terms).
Today’s FOMC minutes seemed to show several policymakers showing concern over slower-than-expected disinflation.
Given that Fed speakers’ communication seems to have become a bit more hawkish this year, it might be likely that the recent drop in long-term yields might have gotten a bit ahead of itself lately.
The economic data later this week on GDP and/or PCE might give some guidance in this regard if they come in stronger than expected.
Technically speaking, the pullback to meaningful trendline support coupled with the reversal of trend during Thursday’s session seems to tilt the odds towards a rise in 10, and 30-year Treasury bond yields in the weeks to come.
I anticipate that a bounce up to 4.50-4.60% cannot be ruled out and seems likely over the next month. However, if/when rates start to push up more aggressively, it will be important to watch how this might correlate with Equities and/or precious metals reversing course.
For now, I like playing for a sharp bounce in 10-yr. Treasury yields have returned to the top of the range.
US Government Bonds 10 YR Yield
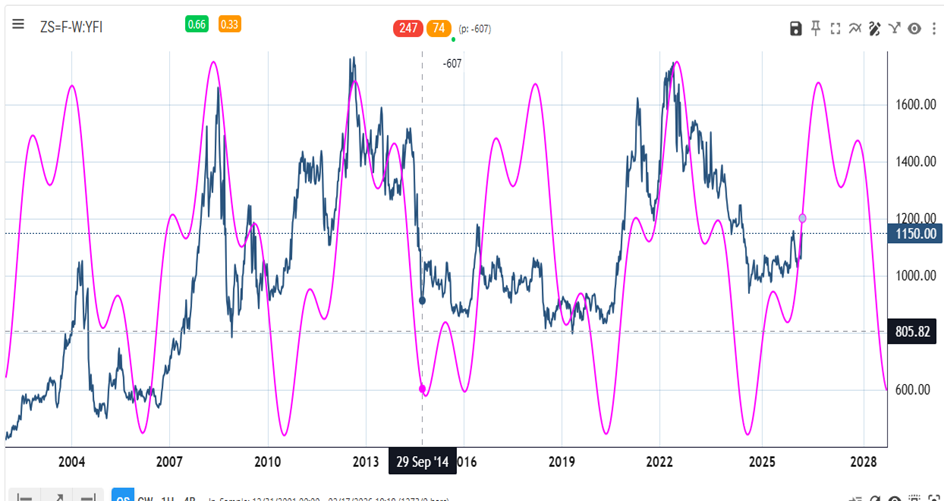
Grains should be turning up sharply this year if cycles continue to work as they have historically
My mention of the Agricultural stocks’ outperformance lately warranted some study of the grains cycles, as Corn, Wheat, and Soybeans all made intermediate-term lows back in 2020.
While this composite might not always continue to work going forward, there seems to be a prevalent six-year cycle in grains prices that should turn up sharply this year and aligns with what my cycle composite shows is likely for Soybeans prices between now and Q4 of 2026.
This cycle composite on weekly Soybeans going back since 2003 mirrors what Corn and Wheat are also showing to be possible for this year, and I anticipate that all three of these should begin turning higher sooner than later.
As mentioned last week, the intermediate-term trends have not turned up sufficiently yet to be able to make a bullish technical call for a rally. Yet, Soybeans appear stronger than either Corn or Wheat and look close to beginning its move higher.
Not many ETFs are liquid enough to make suggestions on ways to follow grain prices without trading commodity futures, but Teucrium has several that might be worthy of consideration. WEAT, CORN, and SOYB are all grain-related ETFs that correspond to the prices of Wheat, Corn, and Soybeans, respectively. Additionally, DBA is Invesco’s DB Agriculture Fund, which also looks close to turning higher following the last month of consolidation.
Overall, I am bullish for a grain rally in 2026 and expect strength throughout much of 2026 in grains prices.
Soybean Cycle Composite